OPEN-SOURCE SCRIPT
Sessions & Breaks
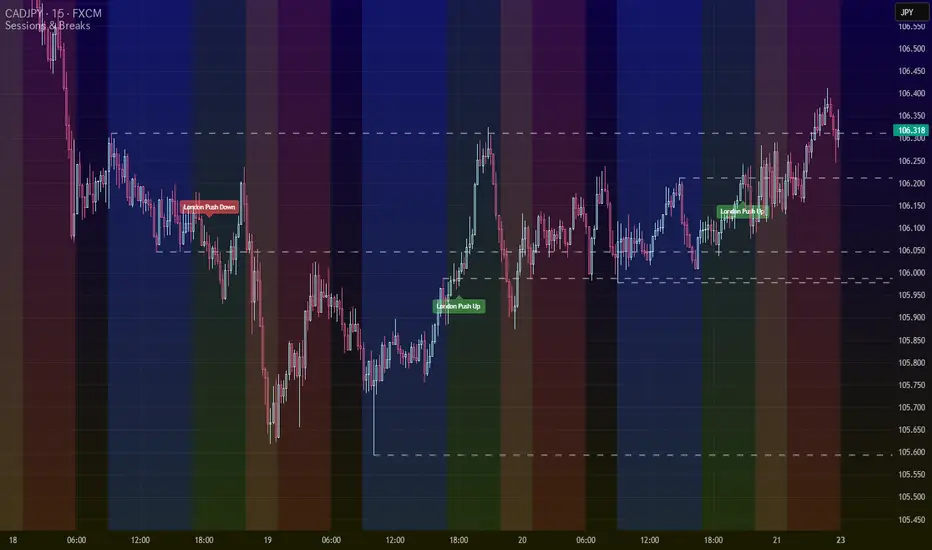
1. Session Highlighting: It visually distinguishes the Asian, London, and New York trading sessions by applying different colored backgrounds to the chart for each session.The start and end times for these sessions are customizable in Japan Standard Time.
2. Asian Session Range: The indicator identifies the price range of the Asian session.Users can choose whether this range is determined by the session's highest and lowest prices ("High/Low") or its opening and closing prices ("Open/Close").
3. Range Persistence and Display: It draws horizontal lines to mark the upper and lower boundaries of the Asian session range. These lines extend to the right, serving as potential support and resistance levels for subsequent sessions. The user can specify how many days these historical range lines should remain visible on the chart (from 1 to 5 days). The style of these lines (solid, dotted, or dashed) is also customizable.
4. London Session Breakout Detection: It identifies and signals potential breakouts during the London session. If the price closes above the Asian session's high, it generates a "London Push Up" label. Conversely, if the price closes below the Asian session's low, it displays a "London Push Down" label. These labels only appear for the first breakout in either direction within the London session.
In summary, this tool helps traders visualize market activity across the major trading sessions and automatically identifies key price levels from the Asian session to monitor for potential breakouts during the London session.
1. セッションのハイライト: アジア、ロンドン、ニューヨークの各主要取引セッションを、それぞれ異なる背景色でチャート上に表示します.これにより、現在のセッションを視覚的に簡単に識別できます。セッションの開始・終了時刻は、日本標準時(JST)で自由に設定可能です。
2. アジアセッションのレンジ特定: アジアセッション中の価格範囲(レンジ)を特定します。[3] このレンジを、セッション中の「高値・安値」を基準にするか、「始値・終値」を基準にするかをユーザーが選択できます。
3. レンジの描画と保持: 特定したアジアセッションのレンジ上限(レジスタンス)と下限(サポート)に水平線を描画します。このラインはその後のセッションに向けて右側へ延長され、将来のサポートやレジスタンスレベルとして機能する可能性があります. 過去何日分のアジアレンジラインをチャートに表示し続けるか(1日から5日まで)を設定でき、線のスタイル(実線、点線、破線)も変更可能です。
4. ロンドンセッションのブレイクアウト検出: ロンドンセッション中にアジアセッションのレンジをブレイクした際に、その動きをラベルで通知します。価格がアジアレンジの高値を上に抜けたら「London Push Up」、安値を下に抜けたら「London Push Down」というラベルが表示されます。これらのラベルは、ロンドンセッション中の各方向への最初のブレイクアウト時にのみ表示されます。
要約すると、このツールは主要な取引セッションごとの市場の活動を可視化し、アジアセッションで形成された重要な価格帯を自動で特定して、その後のロンドンセッションでのブレイクアウト戦略などに役立てることができるインジケータです。
Skrip sumber terbuka
Dalam semangat sebenar TradingView, pencipta skrip ini telah menjadikannya sumber terbuka supaya pedagang dapat menilai dan mengesahkan kefungsiannya. Terima kasih kepada penulis! Walaupun anda boleh menggunakannya secara percuma, ingat bahawa menerbitkan semula kod ini adalah tertakluk kepada Peraturan Dalaman kami.
Penafian
Maklumat dan penerbitan adalah tidak dimaksudkan untuk menjadi, dan tidak membentuk, nasihat untuk kewangan, pelaburan, perdagangan dan jenis-jenis lain atau cadangan yang dibekalkan atau disahkan oleh TradingView. Baca dengan lebih lanjut di Terma Penggunaan.