OPEN-SOURCE SCRIPT
Telah dikemas kini Volume Pressure
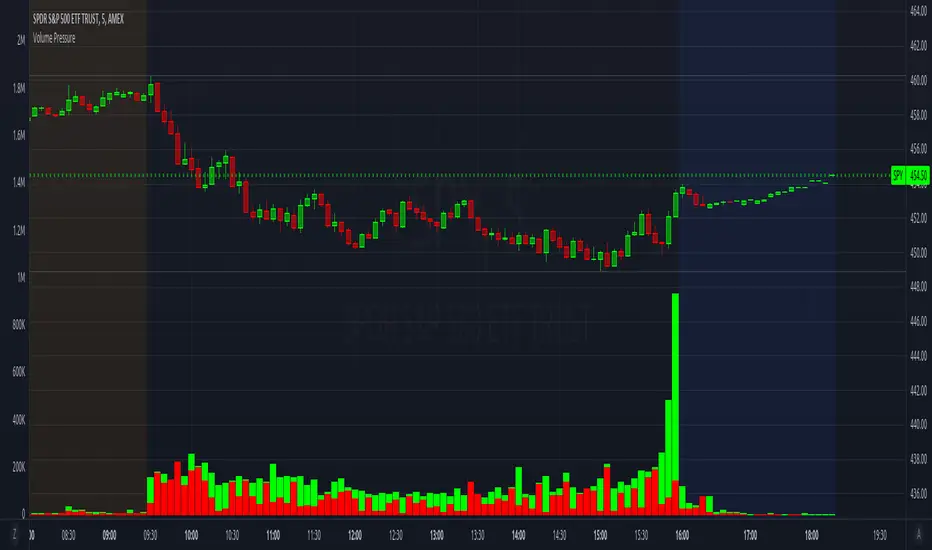
Breaks down volume into buyers (green part) vs sellers (red part).
It is recommended to set the volume's scale, especially if you switch tickers on the same chart. Follow these steps:
To update to the latest version, just close the indicator and add it again.
It is recommended to set the volume's scale, especially if you switch tickers on the same chart. Follow these steps:
- Select the Volume Pressure indicator's 3 dots (...)
- Select Pin To Scale
- Select a separate scale from the main chart, such as Pin To New Left Scale (Z)
- Left click and hold the scale on the side of the chart and drag it up/down to bring the volume bars into the desired area
To update to the latest version, just close the indicator and add it again.
Nota Keluaran
Additional info on the Volume Pressure bars:On a green candle:
- The red part represents the upper wick, the volume as the price comes back down from its high
- The green part represents the rest of the candle, the volume as the price goes up from its low to the close
On a red candle:
- The green part represents the lower wick, the volume as the price comes back up from its low
- The red part represents the rest of the candle, the volume as the price goes down from its high to the close
Nota Keluaran
Added scale property to force it to the left side; this should prevent it from using the chart's main price scale and filling the screenNota Keluaran
Updated screenshotNota Keluaran
Fixed problem with volume bars jumping around when switching between tickers. Added a hidden scale line that keeps them relatively consistent.Skrip sumber terbuka
Dalam semangat TradingView sebenar, pencipta skrip ini telah menjadikannya sumber terbuka, jadi pedagang boleh menilai dan mengesahkan kefungsiannya. Terima kasih kepada penulis! Walaupuan anda boleh menggunakan secara percuma, ingat bahawa penerbitan semula kod ini tertakluk kepada Peraturan Dalaman.
Penafian
Maklumat dan penerbitan adalah tidak bertujuan, dan tidak membentuk, nasihat atau cadangan kewangan, pelaburan, dagangan atau jenis lain yang diberikan atau disahkan oleh TradingView. Baca lebih dalam Terma Penggunaan.
Skrip sumber terbuka
Dalam semangat TradingView sebenar, pencipta skrip ini telah menjadikannya sumber terbuka, jadi pedagang boleh menilai dan mengesahkan kefungsiannya. Terima kasih kepada penulis! Walaupuan anda boleh menggunakan secara percuma, ingat bahawa penerbitan semula kod ini tertakluk kepada Peraturan Dalaman.
Penafian
Maklumat dan penerbitan adalah tidak bertujuan, dan tidak membentuk, nasihat atau cadangan kewangan, pelaburan, dagangan atau jenis lain yang diberikan atau disahkan oleh TradingView. Baca lebih dalam Terma Penggunaan.