OPEN-SOURCE SCRIPT
Example of Code for Moving Average Cross - Changing Colors
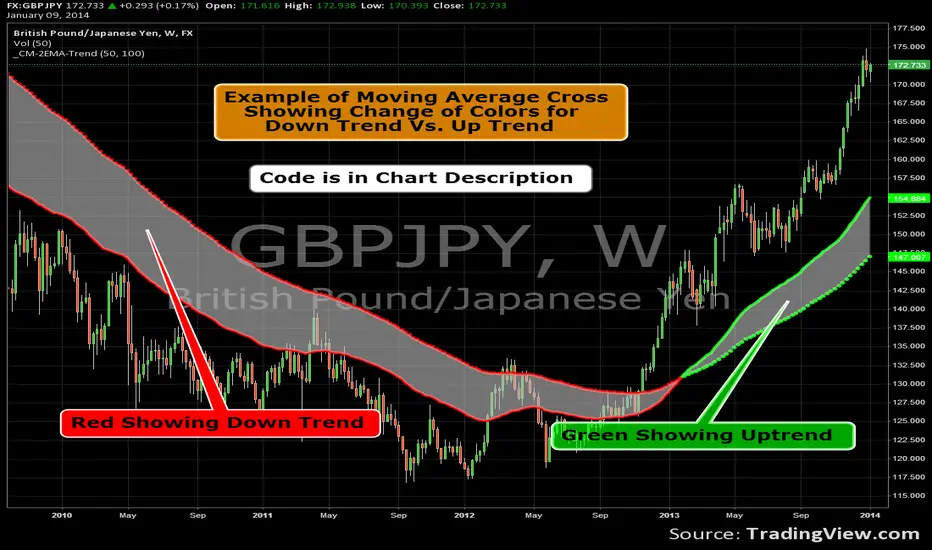
Famous 7 Time World Trading Champion Chuck Hughes found the 50 and 100 EMA to be the best Signal for a Change in Trend. Through extensive back-testing he found these EMA’s to give the earliest signal that also resulted in a Long-Term Change in Trend.
Dotted Line represents Long-Term EMA. The 100 EMA in this example.
Solid line represents the Short-Term EMA. The 50 EMA in this example.
If Short-Term EMA is ABOVE Long-Term EMA...Color = Green.
If Short-Term EMA is BELOW Long-Term EMA...Color = Red.
Dotted Line represents Long-Term EMA. The 100 EMA in this example.
Solid line represents the Short-Term EMA. The 50 EMA in this example.
If Short-Term EMA is ABOVE Long-Term EMA...Color = Green.
If Short-Term EMA is BELOW Long-Term EMA...Color = Red.
Skrip sumber terbuka
Dalam semangat TradingView sebenar, pencipta skrip ini telah menjadikannya sumber terbuka, jadi pedagang boleh menilai dan mengesahkan kefungsiannya. Terima kasih kepada penulis! Walaupuan anda boleh menggunakan secara percuma, ingat bahawa penerbitan semula kod ini tertakluk kepada Peraturan Dalaman.
Coming Soon: ChrisMoodyTrading.com
Penafian
Maklumat dan penerbitan adalah tidak bertujuan, dan tidak membentuk, nasihat atau cadangan kewangan, pelaburan, dagangan atau jenis lain yang diberikan atau disahkan oleh TradingView. Baca lebih dalam Terma Penggunaan.