PROTECTED SOURCE SCRIPT
Telah dikemas kini Bog™ Cycle Detector
The Cycle Detector is a tool that can be used to dial in the Bog if you are having difficulty. Think of it like training wheels. You can measure the average cycle length and average the Bog in according to the formula explained below. You want to set the Bog length to half the average length of the Cycle Detector and the channel length to 1/4 of the average length of the Cycle Detector.
THIS INDICATOR DOES NOT GIVE BUY OR SELL SIGNALS. THIS INDICATOR IS ONLY USED TO DIAL IN THE SETTINGS OF THE BOG ONLY
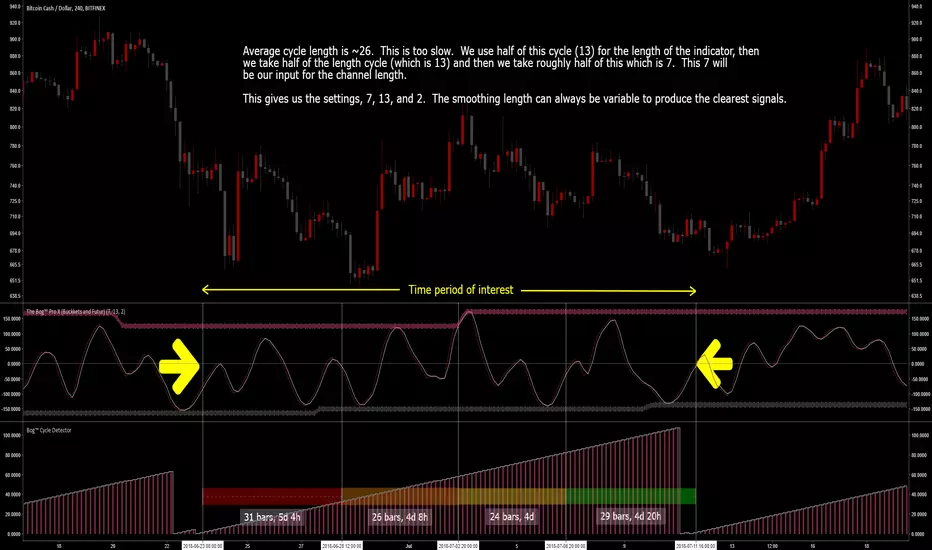
Example for the chart above:
Average cycle length is ~26. This is too slow. We use half of this cycle (13) for the length of the indicator, then we take half of the length cycle (which is 13) and then we take roughly half of this which is 7. This 7 will be our input for the channel length.
This gives us the settings, 7, 13, and 2. The smoothing length can always be variable to produce the clearest signals.
Dealing with Chop:
On occasion, when trends are changing, you may find micro bumps or trends. You can either divide these or combine them into the larger trend. In the chart below, there are two possible ways to process the data. Either two smaller triangles could be considered, or one larger triangle could be generated. With time you with have a good idea of how to best interpret these residual signals.

THIS INDICATOR DOES NOT GIVE BUY OR SELL SIGNALS. THIS INDICATOR IS ONLY USED TO DIAL IN THE SETTINGS OF THE BOG ONLY
Example for the chart above:
Average cycle length is ~26. This is too slow. We use half of this cycle (13) for the length of the indicator, then we take half of the length cycle (which is 13) and then we take roughly half of this which is 7. This 7 will be our input for the channel length.
This gives us the settings, 7, 13, and 2. The smoothing length can always be variable to produce the clearest signals.
Dealing with Chop:
On occasion, when trends are changing, you may find micro bumps or trends. You can either divide these or combine them into the larger trend. In the chart below, there are two possible ways to process the data. Either two smaller triangles could be considered, or one larger triangle could be generated. With time you with have a good idea of how to best interpret these residual signals.
Nota Keluaran
Adjusted cycle lengthSkrip dilindungi
Skrip ini diterbitkan sebagai sumber tertutup. Akan tetapi, anda boleh menggunakannya secara bebas dan tanpa apa-apa had – ketahui lebih di sini.
Penafian
Maklumat dan penerbitan adalah tidak bertujuan, dan tidak membentuk, nasihat atau cadangan kewangan, pelaburan, dagangan atau jenis lain yang diberikan atau disahkan oleh TradingView. Baca lebih dalam Terma Penggunaan.
Skrip dilindungi
Skrip ini diterbitkan sebagai sumber tertutup. Akan tetapi, anda boleh menggunakannya secara bebas dan tanpa apa-apa had – ketahui lebih di sini.
Penafian
Maklumat dan penerbitan adalah tidak bertujuan, dan tidak membentuk, nasihat atau cadangan kewangan, pelaburan, dagangan atau jenis lain yang diberikan atau disahkan oleh TradingView. Baca lebih dalam Terma Penggunaan.