OPEN-SOURCE SCRIPT
Telah dikemas kini Histogram - Price Action - Dy Calculator
This script aims to help users of Price Action robot, for Smarttbot (brazilian site that automates Brazilian market (B3)).
You can use on any symbol.
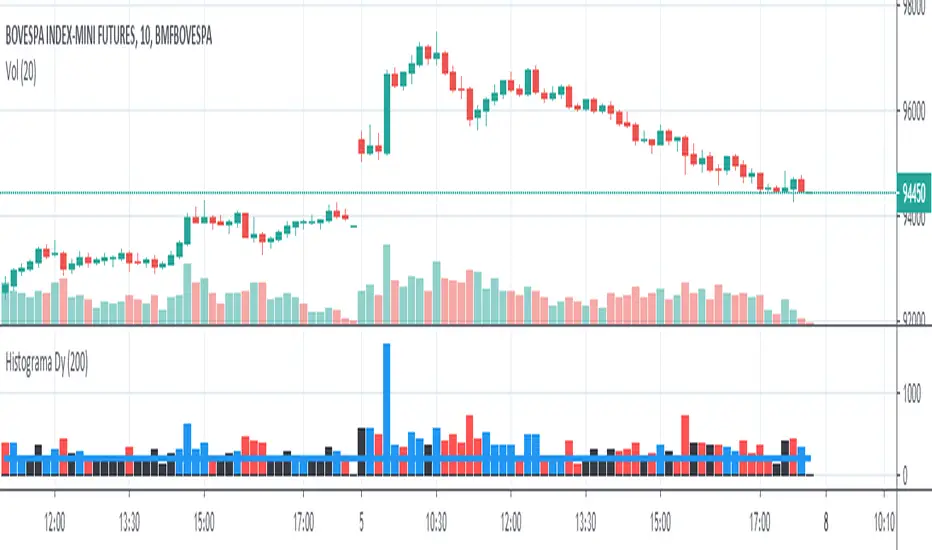
The script will follow price action principles. It will calculate the absolute value of last candle and compare with actual candle. Colors are:
- Red - If the actual candle absolute value is higher than previous one, and the price is lower than last candle. It would be a short entry.
- Blue - If the actual candle absolute value is higher than previous one, and the price is higher than last candle. It would be a long entry.
- Black - The actual candle absolute value is lower than previous one, so there is no entry.
If there is a candle that is higher than previous one, and both high and low values are outside boundaries of previous one, it will calculate which boundary is bigger and will apply the collor accordingly.
You can use on any symbol.
The script will follow price action principles. It will calculate the absolute value of last candle and compare with actual candle. Colors are:
- Red - If the actual candle absolute value is higher than previous one, and the price is lower than last candle. It would be a short entry.
- Blue - If the actual candle absolute value is higher than previous one, and the price is higher than last candle. It would be a long entry.
- Black - The actual candle absolute value is lower than previous one, so there is no entry.
If there is a candle that is higher than previous one, and both high and low values are outside boundaries of previous one, it will calculate which boundary is bigger and will apply the collor accordingly.
Nota Keluaran
V4 - Better candle rupture detection, now it only marks as a rupture when last candle price (high-low) is bigger than dy and it had a rupture.Skrip sumber terbuka
Dalam semangat TradingView sebenar, pencipta skrip ini telah menjadikannya sumber terbuka, jadi pedagang boleh menilai dan mengesahkan kefungsiannya. Terima kasih kepada penulis! Walaupuan anda boleh menggunakan secara percuma, ingat bahawa penerbitan semula kod ini tertakluk kepada Peraturan Dalaman.
Penafian
Maklumat dan penerbitan adalah tidak bertujuan, dan tidak membentuk, nasihat atau cadangan kewangan, pelaburan, dagangan atau jenis lain yang diberikan atau disahkan oleh TradingView. Baca lebih dalam Terma Penggunaan.
Skrip sumber terbuka
Dalam semangat TradingView sebenar, pencipta skrip ini telah menjadikannya sumber terbuka, jadi pedagang boleh menilai dan mengesahkan kefungsiannya. Terima kasih kepada penulis! Walaupuan anda boleh menggunakan secara percuma, ingat bahawa penerbitan semula kod ini tertakluk kepada Peraturan Dalaman.
Penafian
Maklumat dan penerbitan adalah tidak bertujuan, dan tidak membentuk, nasihat atau cadangan kewangan, pelaburan, dagangan atau jenis lain yang diberikan atau disahkan oleh TradingView. Baca lebih dalam Terma Penggunaan.