OPEN-SOURCE SCRIPT
Telah dikemas kini AVWAP Band
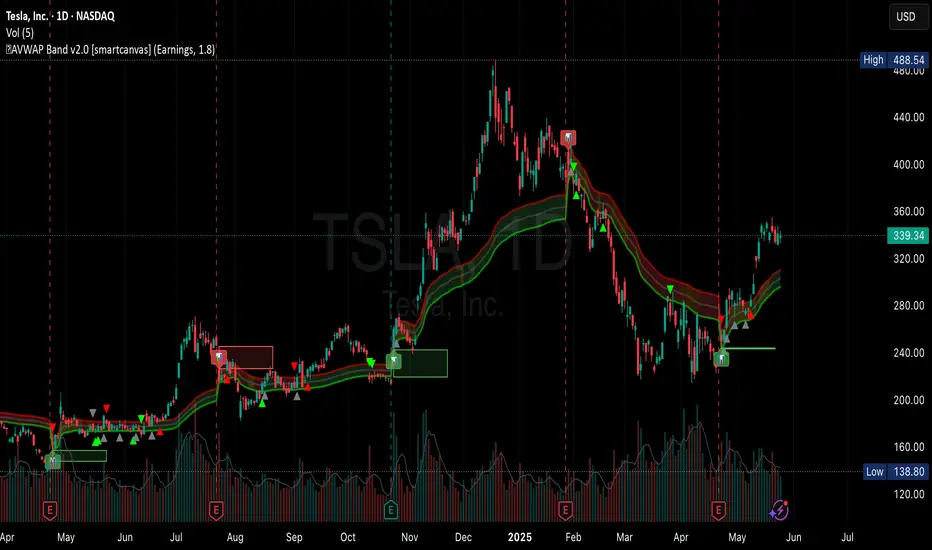
✨ AVWAP Band by Mars ✨
The AVWAP Band indicator eliminates the guesswork of selecting multipliers for your VWAP analysis. Instead of using arbitrary deviations, this indicator provides three distinct VWAP lines calculated from different price points - giving you a complete VWAP band with just one tool.
What Makes This Different From Standard VWAP
Traditional VWAP indicators use multipliers (1.0, 2.0, 3.0) which require constant adjustment across different markets and timeframes. The AVWAP Band simplifies this by using natural price points:
Key Features
How To Use It
Trading Applications
Customization Options
This indicator simplifies VWAP analysis by giving you natural price-based bands without the need to adjust multipliers across different markets. The high, low, and HL2 sources create a complete VWAP picture with just one tool.
VIDEO

Feedback and suggestions welcome!
The AVWAP Band indicator eliminates the guesswork of selecting multipliers for your VWAP analysis. Instead of using arbitrary deviations, this indicator provides three distinct VWAP lines calculated from different price points - giving you a complete VWAP band with just one tool.
What Makes This Different From Standard VWAP
Traditional VWAP indicators use multipliers (1.0, 2.0, 3.0) which require constant adjustment across different markets and timeframes. The AVWAP Band simplifies this by using natural price points:
- Low-based VWAP (green) - acts as support
- High-based VWAP (red) - acts as resistance
- HL2-based VWAP (gray) - acts as the centerline
Key Features
- Reduces cognitive load - no more guessing which multiplier to use
- User-selected anchor point (click to set date)
- Customizable colors and line styles
- Built-in alerts for all crossover/crossunder events
- Visual anchor point marker
How To Use It
- After adding the indicator to your chart, you have to click on your anchor point
- Watch for price reactions at each VWAP line
- Look for crossovers between price and the different VWAPs
- Use the HL2 VWAP as a centerline to determine overall bias
Trading Applications
- Support/Resistance levels for intraday trading
- Mean-reversion signals when price touches band extremes
- Trend confirmation when price holds above/below centerline
- Range identification between upper and lower bands
- Volatility assessment based on band width
Customization Options
- Toggle each VWAP line individually
- Adjust line colors to match your chart theme
- Control line width and transparency
- Enable/disable anchor point label
This indicator simplifies VWAP analysis by giving you natural price-based bands without the need to adjust multipliers across different markets. The high, low, and HL2 sources create a complete VWAP picture with just one tool.
VIDEO
Feedback and suggestions welcome!
Nota Keluaran
CosmeticsNota Keluaran
minor tweakNota Keluaran
- Now swing-high / lows are detected and different anchor labels' colors are usedNota Keluaran
New features included:- Markers for price bouncing / losing the AVWAP lines
- Dynamic fill for the band depending on its movement
Nota Keluaran
quick fixNota Keluaran
making anchor more visibleNota Keluaran
# AVWAP Band v2.0 - What's New## 🆕 New Anchor Types
- **ATH/ATL Detection**: Automatic anchoring at All-Time Highs and Lows
- **Earnings Anchoring**: VWAP from earnings dates with gap visualization
- **Significant Levels**: Custom swing detection finds highest highs/lowest lows
- **Session Anchors**: Weekly/Monthly open support added
## ⚡ Enhanced Swing Detection
- **Custom Algorithm**: Replaces Pine's pivot functions with 30-bar lookback
- **Extreme Point Finding**: Anchors at highest high/lowest low in swing sequences
- **Smart Spacing**: Minimum 10-bar spacing prevents anchor clustering
- **Real-time Detection**: No confirmation delay, immediate swing identification
## 📊 New Statistics & Analytics
- **Success Rate Tracking**: Proper calculation for completed bounce attempts
- **Win/Loss Ratios**: Bounces vs lost support analysis
- **Band Width Monitoring**: Track convergence/divergence
- **Performance Table**: Real-time statistics with color coding
## 🎨 Visual Improvements
- **Enhanced Labels**: Emoji-coded anchor types with detailed tooltips
## 🛠️ Technical Upgrades
- **Robust Error Handling**: Division by zero protection and null checks
- **Optimized Performance**: Pre-calculated colors and variables
- **Manual Date Fix**: Intelligent handling for weekends/holidays
- **Variable Scope Fixes**: Proper Pine Script compliance
---
*Major update with institutional-grade swing detection and earnings integration*
Nota Keluaran
cosmeticNota Keluaran
complianceNota Keluaran
chart updateNota Keluaran
big fixing when anchoringSkrip sumber terbuka
Dalam semangat TradingView sebenar, pencipta skrip ini telah menjadikannya sumber terbuka, jadi pedagang boleh menilai dan mengesahkan kefungsiannya. Terima kasih kepada penulis! Walaupuan anda boleh menggunakan secara percuma, ingat bahawa penerbitan semula kod ini tertakluk kepada Peraturan Dalaman.
Cyclist, Trader, Technologist. Get access to data for my options indicators on smartcanvas.com for free via bots
Penafian
Maklumat dan penerbitan adalah tidak bertujuan, dan tidak membentuk, nasihat atau cadangan kewangan, pelaburan, dagangan atau jenis lain yang diberikan atau disahkan oleh TradingView. Baca lebih dalam Terma Penggunaan.
Skrip sumber terbuka
Dalam semangat TradingView sebenar, pencipta skrip ini telah menjadikannya sumber terbuka, jadi pedagang boleh menilai dan mengesahkan kefungsiannya. Terima kasih kepada penulis! Walaupuan anda boleh menggunakan secara percuma, ingat bahawa penerbitan semula kod ini tertakluk kepada Peraturan Dalaman.
Cyclist, Trader, Technologist. Get access to data for my options indicators on smartcanvas.com for free via bots
Penafian
Maklumat dan penerbitan adalah tidak bertujuan, dan tidak membentuk, nasihat atau cadangan kewangan, pelaburan, dagangan atau jenis lain yang diberikan atau disahkan oleh TradingView. Baca lebih dalam Terma Penggunaan.