OPEN-SOURCE SCRIPT
Multi-Timeframe EMA & SMA Scanner - Price Level Labels
Overview
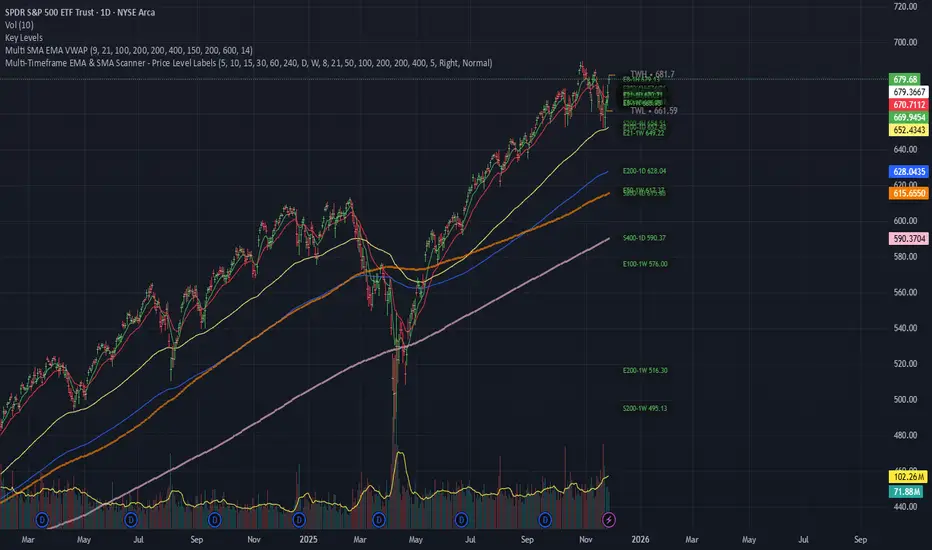
A powerful multi-timeframe moving average scanner that displays EMA and SMA levels from up to 8 different timeframes simultaneously on your chart. Perfect for identifying key support/resistance levels, confluence zones, and multi-timeframe trend analysis.
Key Features
📊 Multi-Timeframe Analysis
Monitor up to 8 different timeframes simultaneously (5m, 10m, 15m, 30m, 1H, 4H, 1D, 1W)
Each timeframe can be independently enabled/disabled
Fully customizable timeframe selection
📈 Comprehensive Moving Averages
5 configurable EMA periods (default: 8, 21, 50, 100, 200)
2 configurable SMA periods (default: 200, 400)
All periods are fully customizable to match your trading strategy
🎯 Smart Price Level Labels
Labels positioned at actual price levels (not in a list)
Color-coded labels for easy identification
Dynamic text color: Green when price is above, Red when below
Compact notation: E8-5m means EMA 8 on 5-minute timeframe
Adjustable label offset from current price
📉 Optional Horizontal Lines
Dotted reference lines at each MA level
Color-matched to corresponding MA type
Can be toggled on/off independently
📋 Comprehensive Data Table
Shows all MA values organized by timeframe
Displays percentage distance from current price
Trend indicator (Strong Up/Up/Neutral/Down/Strong Down)
EMA alignment status (Bullish/Bearish/Mixed)
Color-coded cells for quick visual analysis
🎨 Full Customization
Individual color settings for each MA type
Adjustable table size (Tiny/Small/Normal/Large)
Choose table position (Left/Right)
Toggle any MA or timeframe on/off
🔔 Built-in Alerts
Golden Cross detection (EMA 50 crosses above EMA 200)
Death Cross detection (EMA 50 crosses below EMA 200)
Price crossing major EMAs
Available for multiple timeframes
How to Use
For Day Traders:
Enable lower timeframes (5m, 10m, 15m, 30m)
Focus on faster EMAs (8, 21, 50)
Watch for confluence zones where multiple timeframe MAs cluster
For Swing Traders:
Enable higher timeframes (1H, 4H, 1D)
Use all EMAs plus SMAs for broader perspective
Look for alignment across timeframes for high-probability setups
For Position Traders:
Focus on daily and weekly timeframes
Emphasize 100, 200 EMAs and 200, 400 SMAs
Use for long-term trend confirmation
Understanding the Labels
Label Format: E8-5m 45250.50
E8 = EMA with period 8
5m = 5-minute timeframe
45250.50 = Current price level
Green text = Price is currently above this level (potential support)
Red text = Price is currently below this level (potential resistance)
For SMAs: S200-1D 44500.00
S200 = SMA with period 200
1D = Daily timeframe
Trading Applications
Support/Resistance Identification
MAs act as dynamic support and resistance levels
Multiple timeframe MAs create stronger zones
Confluence Trading
When multiple MAs from different timeframes cluster together, it creates high-probability zones
These areas often result in strong reactions
Trend Analysis
Check the Alignment column: Bullish alignment = all EMAs in ascending order
Trend column shows overall price position relative to all MAs
Entry/Exit Timing
Use lower timeframe MAs for precise entries
Use higher timeframe MAs for trend direction and exits
Settings Guide
Timeframes Section:
Select and enable/disable up to 8 timeframes
Default: 5m, 10m, 15m, 30m, 1H, 4H, 1D, 1W
MA Periods Section:
Customize all EMA and SMA periods
Default EMAs: 8, 21, 50, 100, 200
Default SMAs: 200, 400
Display Section:
Toggle price labels and horizontal lines
Adjust label offset (distance from right edge)
Show/hide data table
Choose table position and size
Colors Section:
Customize colors for each MA type
Each MA has independent color control
Pro Tips
✅ Start with default settings and adjust based on your trading style
✅ Disable timeframes/MAs you don't use to reduce chart clutter
✅ Use the data table for quick overview, labels for precise levels
✅ Look for "confluence clusters" where multiple MAs from different timeframes align
✅ Green labels = potential support, Red labels = potential resistance
✅ Set alerts on key crossovers for automated notifications
Technical Specifications
Pine Script v6
Overlay indicator (displays on main chart)
Maximum 500 labels supported
Real-time updates on each bar close
Compatible with all instruments and timeframes
Perfect For:
Day traders seeking multi-timeframe confirmation
Swing traders looking for high-probability setups
Position traders monitoring long-term trends
Anyone using moving averages as part of their strategy
Note: This indicator does not provide buy/sell signals. It's a tool for analysis and should be used in conjunction with your trading strategy and risk management rules.
Skrip sumber terbuka
In true TradingView spirit, the creator of this script has made it open-source, so that traders can review and verify its functionality. Kudos to the author! While you can use it for free, remember that republishing the code is subject to our House Rules.
Penafian
The information and publications are not meant to be, and do not constitute, financial, investment, trading, or other types of advice or recommendations supplied or endorsed by TradingView. Read more in the Terms of Use.