PROTECTED SOURCE SCRIPT
CPR+PIVOT+HL+EMA_ by Jit's
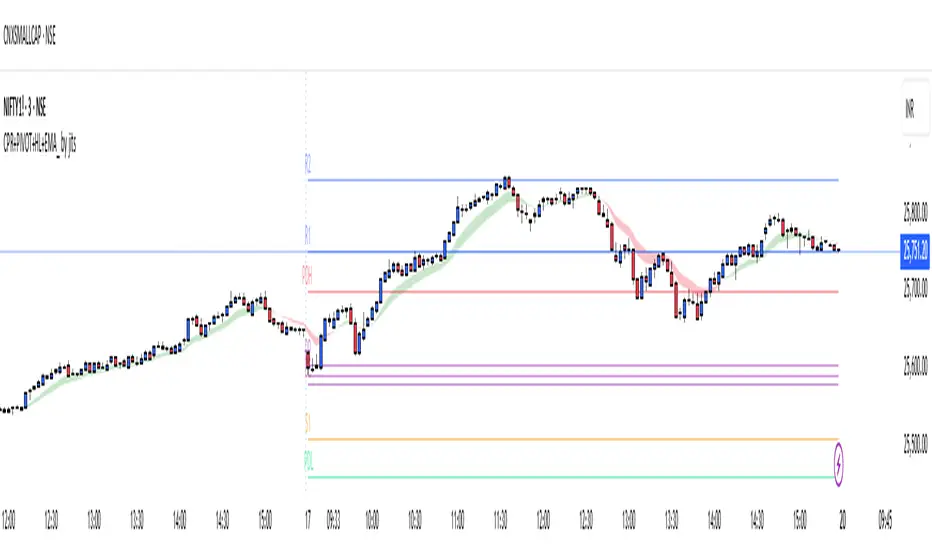
The **CPR+PIVOT+HL+EMA_ by Jit's** is a custom Trading View indicator designed especially for **index intraday trading** (like NIFTY, BANKNIFTY, and FINNIFTY). It integrates four powerful analytical components—Central Pivot Range (CPR), Pivot Points, Previous Day High/Low, and 9/15 Exponential Moving Averages (EMA)—to provide traders a comprehensive market structure and trend confirmation tool.
Core Components
**1. Central Pivot Range (CPR)**
The CPR forms the central structure of this indicator. It is derived from the previous day’s **high, low, and close** values:
- Pivot (P) = (H + L + C) / 3
- Bottom Central (BC) = (H + L) / 2
- Top Central (TC) = (P - BC) + P
These three levels together represent the market’s “value area.”
A **narrow CPR** suggests a potential trending day ahead, while a **wide CPR** indicates likely consolidation.
**2. Pivot Points & Support/Resistance Levels**
The indicator extends beyond CPR by adding **traditional or Fibonacci pivots**, dynamically plotting resistance (R1–R5) and support (S1–S5) zones. These levels assist in spotting breakout levels and intraday reversal zones.
**3. Previous Day High and Low (PDH/PDL)**
These levels are essential for understanding market context. When price stays **above PDH**, it often signals strong bullish momentum; breaking **below PDL** indicates bearish pressure. Many traders use PDH/PDL along with CPR as key validation points for entries or exits.
**4. EMA (9 and 15 periods)**
The moving averages provide short-term trend confirmation.
- **EMA(9)** captures immediate momentum.
- **EMA(15)** represents short-term trend alignment.
A crossover of EMA(9) above EMA(15) usually supports a **buy signal**, while the opposite indicates a sell bias.
Use Case in Index Trading
This indicator setup is highly suited for **index-based intraday trading** because:
- CPR gives a bias for the day (bullish/bearish).
- PDH/PDL exhibit clear breakout or reversal areas.
- EMAs refine timing for entry/exit.
- Pivot levels mark precise target and stop zones.
Skrip dilindungi
Skrip ini diterbitkan sebagai sumber tertutup. Akan tetapi, anda boleh menggunakannya secara bebas dan tanpa apa-apa had – ketahui lebih di sini.
Penafian
Maklumat dan penerbitan adalah tidak bertujuan, dan tidak membentuk, nasihat atau cadangan kewangan, pelaburan, dagangan atau jenis lain yang diberikan atau disahkan oleh TradingView. Baca lebih dalam Terma Penggunaan.