PROTECTED SOURCE SCRIPT
Different Resolutions Trender

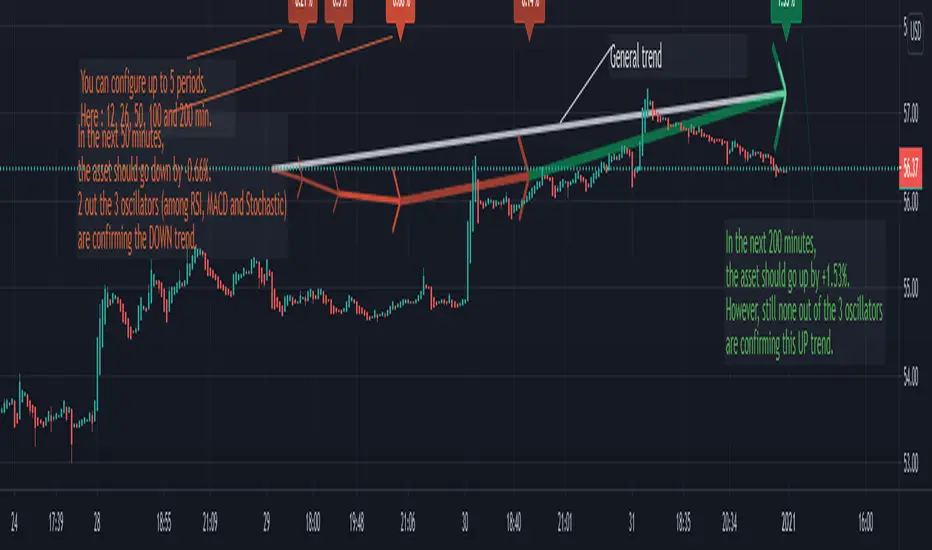
This script aims at giving the quickest insight over different time resolutions and their relative trends.
The graph is updated on every new bar.
5 periods of time can be configured with each their own signal periods.
For each period, you get an insight on:
- its general movement in comparison the latest close (green: up / red: down)
- its length (ex: 50 minutes)
- its movement (ex: -0.66%)
- its probability (ex: 2 out of 3 oscillators confirming the trend)
[To be improved]
I would be happy to add any useful content on this.
Especially being able to offset this predictive general trend to the right on the last bar, which I do not think is feasible on Pine so far.
Skrip dilindungi
Skrip ini diterbitkan sebagai sumber tertutup. Akan tetapi, anda boleh menggunakannya secara bebas dan tanpa apa-apa had – ketahui lebih di sini.
Penafian
Maklumat dan penerbitan adalah tidak bertujuan, dan tidak membentuk, nasihat atau cadangan kewangan, pelaburan, dagangan atau jenis lain yang diberikan atau disahkan oleh TradingView. Baca lebih dalam Terma Penggunaan.