OPEN-SOURCE SCRIPT
Multi-Trend Synchronizer
Multi-Trend Synchronizer
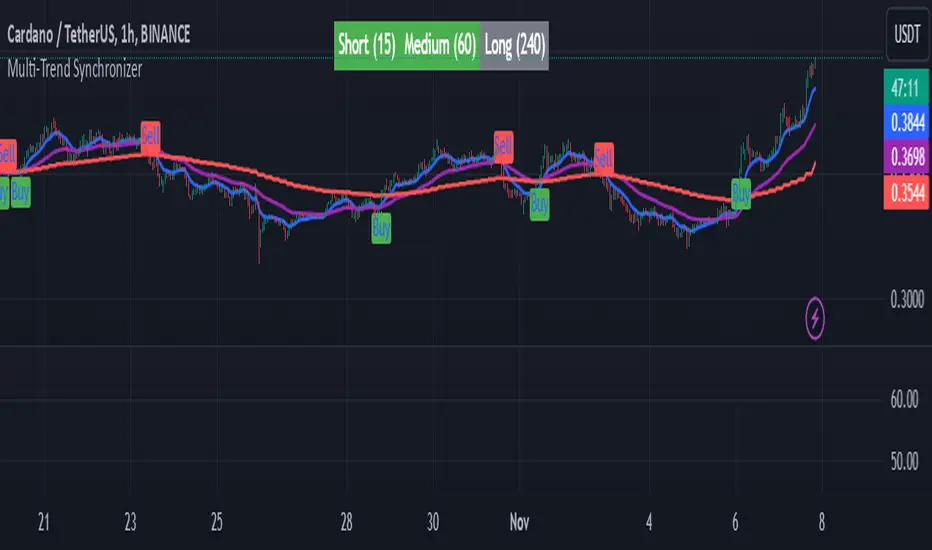
The Multi-Trend Synchronizer indicator provides a multi-timeframe trend analysis using SMMA (Smoothed Moving Average) across three user-defined timeframes: short, medium, and long-term. By synchronizing trends from these timeframes, this tool helps traders identify stronger alignment signals for potential trend continuation or reversal, enhancing decision-making in various market conditions.
Key Features
Multi-Timeframe Trend Analysis: Users can set three different timeframes, allowing flexibility in tracking trends over short (e.g., 15 minutes), medium (e.g., 1 hour), and long-term (e.g., 4 hours) intervals.
Clear Trend Visualization: The indicator plots SMMA lines on the main chart, color-coded by timeframe for intuitive reading. It also displays an at-a-glance trend alignment table, showing the current trend direction (bullish, bearish, or neutral) for each timeframe.
Buy and Sell Signals: Alignment across all timeframes generates Buy and Sell signals, visualized on the chart with distinct markers to aid entry/exit timing.
Usage Notes
This indicator is best used for trend-following strategies. The SMMA-based design provides smoother trend transitions, reducing noise compared to standard moving averages. However, as with all indicators, it is not foolproof and should be combined with other analyses for robust decision-making.
How It Works
The indicator calculates SMMA values for each selected timeframe and tracks trend changes based on SMMA's direction. When all timeframes show a unified direction (either bullish or bearish), the indicator generates a Buy or Sell signal. A table displays real-time trend direction, with color codes to assist traders in quickly assessing the market's overall direction.
Indicator Settings
Timeframes: Customize each SMMA timeframe to align with personal trading strategies or market conditions.
SMMA Length: Adjust the length of the SMMA to control sensitivity. Lower values may increase signal frequency, while higher values provide smoother, more stable trend indicators.
Disclaimer: As with any trend-following tool, this indicator is most effective when used in trending markets and may be less reliable in sideways conditions. Past performance does not guarantee future results, and users should be cautious of market volatility.
Use it for educational purposes!
Skrip sumber terbuka
Dalam semangat TradingView sebenar, pencipta skrip ini telah menjadikannya sumber terbuka, jadi pedagang boleh menilai dan mengesahkan kefungsiannya. Terima kasih kepada penulis! Walaupuan anda boleh menggunakan secara percuma, ingat bahawa penerbitan semula kod ini tertakluk kepada Peraturan Dalaman.
Penafian
Maklumat dan penerbitan adalah tidak bertujuan, dan tidak membentuk, nasihat atau cadangan kewangan, pelaburan, dagangan atau jenis lain yang diberikan atau disahkan oleh TradingView. Baca lebih dalam Terma Penggunaan.