Stoch RSI Time Statistics
The Stochastic RSI is an open source script that was developed by Tushar Chande and Stanley Kroll and introduced in their book "The New Technical Trader" in 1994. It combines two popular indicators: the “Relative Strength Index (RSI)” and the “Stochastic Oscillator”.
The “Stochastic RSI Time Statistics” uses the stochastic RSI calculations and additionally calculates various probability and frequency statistics to better understand the momentum oscillator’s behaviour and guide our strategies and risk management.
Statistics & Probabilities:
The indicator calculates important time and frequency-based metrics that provide deeper insight into the behaviour of the Stochastic RSI. These are displayed in a text box on the indicator panel, including:
Key Features:
Oversold: When the Stochastic RSI is below 20, it indicates that the RSI is in a low range, and the asset may be oversold, potentially signalling a buying opportunity.
Overbought: When the Stochastic RSI is above 80, it suggests the RSI is in a high range, meaning the asset may be overbought and a downturn might be near.
The Stochastic RSI Slope indicates the prominent trend direction within a relevant time period.
Customizable Buy Signal Level (typically below 20-25 percentile) to detect oversold conditions. Customizable Sell Signal Level (typically above 75-80 percentile) to detect overbought conditions. These levels help you spot potential reversal zones where long or short trades might be initiated.
Crossover Alerts:
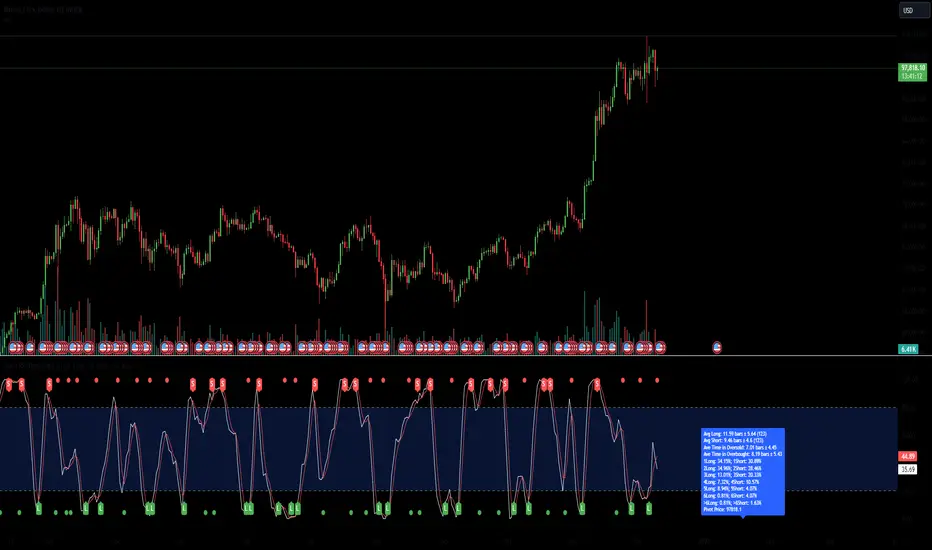
The indicator tracks crossovers between the K and D lines, generating long signals when a crossover occurs below the buy signal level (indicating oversold conditions) and short signals when a cross under occurs above the sell signal level (indicating overbought conditions). The signals are visualized as labels on the chart:
**L** for potential long (buy) signals: Marked below the bars when the K line crosses above the D line.
**S** for potential short (sell) signals: Marked above the bars when the K line crosses below the D line.
Visual Alerts are generated based on these signals.
Risk Management
Although the Stochastic RSI is typically regarded as presenting trend direction and overbought and oversold conditions when in the extreme zones, the RSI can linger and cross over or under numerous times while in the critical zone. The statistics added to the Stochastic RSI indicator allows one to assess the statistical probability of numerous crossover signals occurring on an asset or at various time frames. Signal levels, or preferred definitions of the critical zones can be adjusted while the statistics are automatically updated to the relevant ticker or time frame. Colours and Signal shapes are adjustable to suite your visual preferences.
By using this indicator, you acknowledge and agree that:
No Guarantees: The indicator is provided "as-is" without any warranties or guarantees of accuracy, completeness, or fitness for a particular purpose. The outcomes or performance of trades executed using this indicator are not guaranteed to be successful or profitable.
User Responsibility: You are solely responsible for any trading decisions you make based on the use of this indicator. All trading and investment activities involve risk, and it is essential to conduct your own research, analysis, and due diligence before making any financial decisions.
No Liability: The creator of this indicator is not responsible for any financial losses, direct or indirect, incurred as a result of using this indicator. This includes, but is not limited to, loss of profits, loss of capital, or any other negative financial outcomes.
Market Risks: Markets are volatile, and prices may fluctuate significantly. Trading and investing carry inherent risks, and there is always the potential for loss. You should only trade with capital that you can afford to lose.
Independent Advice: It is strongly recommended that you seek independent financial advice from a qualified and licensed professional before making any trading or investment decisions based on the use of this indicator.
By using this indicator, you acknowledge that you fully understand and accept the risks involved, and you agree to indemnify and hold harmless the creator of this indicator from any claims, damages, or liabilities arising from its use.
The author of this script has made every effort to ensure that the code is an original interpretation and application of the open-source Stochastic RSI, as developed by the original authors, Tushar Chande and Stanley Kroll. The script reflects a unique adaptation aimed at enhancing trading strategies through advanced statistical analysis and trade management features. The author does not claim any proprietary rights over the foundational concepts of the Stochastic RSI and does not intend to infringe upon any existing copyrights. Should any copyright infringement be identified, the author commits to removing the indicator immediately and forfeits any rights to further or intended financial gain from its use.
The Stochastic RSI is an open source script that was developed by Tushar Chande and Stanley Kroll and introduced in their book "The New Technical Trader" in 1994. It combines two popular indicators: the “Relative Strength Index (RSI)” and the “Stochastic Oscillator”.
The “Stochastic RSI Time Statistics” uses the stochastic RSI calculations and additionally calculates various probability and frequency statistics to better understand the momentum oscillator’s behaviour and guide our strategies and risk management.
Statistics & Probabilities:
The indicator calculates important time and frequency-based metrics that provide deeper insight into the behaviour of the Stochastic RSI. These are displayed in a text box on the indicator panel, including:
Avg Long: The average number of bars between the last long signal before exiting the critical zone and the next short signal in the overbought critical zone, including the standard deviation and the sample size within the relevant time frame.
Avg Short: The average number of bars between the last short signal before exiting the critical zone and the next long signal in the oversold critical zone, including the standard deviation and the sample size within the relevant time frame.
Time in Oversold: The average time (in bars/candle sticks) that the Stochastic RSI lines (K & D Lines both in critical zone) spends in the oversold region (below the buy signal level) after entering the oversold region and until both K & D lines depart from the oversold region, along with the standard deviation.
Time in Overbought: The average time (in bars/candle sticks) that the Stochastic RSI lines (K & D Lines both in critical zone) spends in the overbought region (above the sell signal level), after entering the overbought region and until both K & D lines depart from the overbought region, along with the standard deviation.
Signal Frequency: It calculates the percentage of crossover and crossunder occasions within critical zones at different frequencies answering the question, "How many times does the oscilator cross under or over withing the critical zones before making its way to the opposing critical zone?" This measurement is provided for up to 6 occurrances and summarised for frequencies after 6 (e.g., 1Long: 40.54%, 2 Long:28.55%, 3Long 17.4%, >3 Long:13.51%, 1Short:36.15%, 2Short:30.41%, 3Short:17.57%, >3Short:15.88%).
By using this indicator, you acknowledge and agree that:
No Guarantees: The indicator is provided "as-is" without any warranties or guarantees of accuracy, completeness, or fitness for a particular purpose. The outcomes or performance of trades executed using this indicator are not guaranteed to be successful or profitable.
User Responsibility: You are solely responsible for any trading decisions you make based on the use of this indicator. All trading and investment activities involve risk, and it is essential to conduct your own research, analysis, and due diligence before making any financial decisions.
No Liability: The creator of this indicator is not responsible for any financial losses, direct or indirect, incurred as a result of using this indicator. This includes, but is not limited to, loss of profits, loss of capital, or any other negative financial outcomes.
Market Risks: Markets are volatile, and prices may fluctuate significantly. Trading and investing carry inherent risks, and there is always the potential for loss. You should only trade with capital that you can afford to lose.
Independent Advice: It is strongly recommended that you seek independent financial advice from a qualified and licensed professional before making any trading or investment decisions based on the use of this indicator.
By using this indicator, you acknowledge that you fully understand and accept the risks involved, and you agree to indemnify and hold harmless the creator of this indicator from any claims, damages, or liabilities arising from its use.
The author of this script has made every effort to ensure that the code is an original interpretation and application of the open-source Stochastic RSI, as developed by the original authors, Tushar Chande and Stanley Kroll. The script reflects a unique adaptation aimed at enhancing trading strategies through advanced statistical analysis and trade management features. The author does not claim any proprietary rights over the foundational concepts of the Stochastic RSI and does not intend to infringe upon any existing copyrights. Should any copyright infringement be identified, the author commits to removing the indicator immediately and forfeits any rights to further or intended financial gain from its use.
Skrip jemputan sahaja
Hanya pengguna disahkan oleh penulis boleh mengakses skrip ini. Anda perlu memohon dan mendapatkan kebenaran untuk menggunakannya. Keizinan selalunya diberikan selepas pembayaran. Untuk lebih butiran, ikuti arahan penulis di bawah atau hubungi The_Other_Otto secara terus.
TradingView TIDAK menyarankan pembayaran atau penggunaan skrip kecuali anda mempercayai sepenuhnya penulis dan memahami bagaimana ia berfungsi. Anda juga boleh menjumpai alternatif sumber terbuka dan percuma yang lain di dalam skrip komuniti kami.
Arahan penulis
Penafian
Skrip jemputan sahaja
Hanya pengguna disahkan oleh penulis boleh mengakses skrip ini. Anda perlu memohon dan mendapatkan kebenaran untuk menggunakannya. Keizinan selalunya diberikan selepas pembayaran. Untuk lebih butiran, ikuti arahan penulis di bawah atau hubungi The_Other_Otto secara terus.
TradingView TIDAK menyarankan pembayaran atau penggunaan skrip kecuali anda mempercayai sepenuhnya penulis dan memahami bagaimana ia berfungsi. Anda juga boleh menjumpai alternatif sumber terbuka dan percuma yang lain di dalam skrip komuniti kami.