OPEN-SOURCE SCRIPT
Trend Length
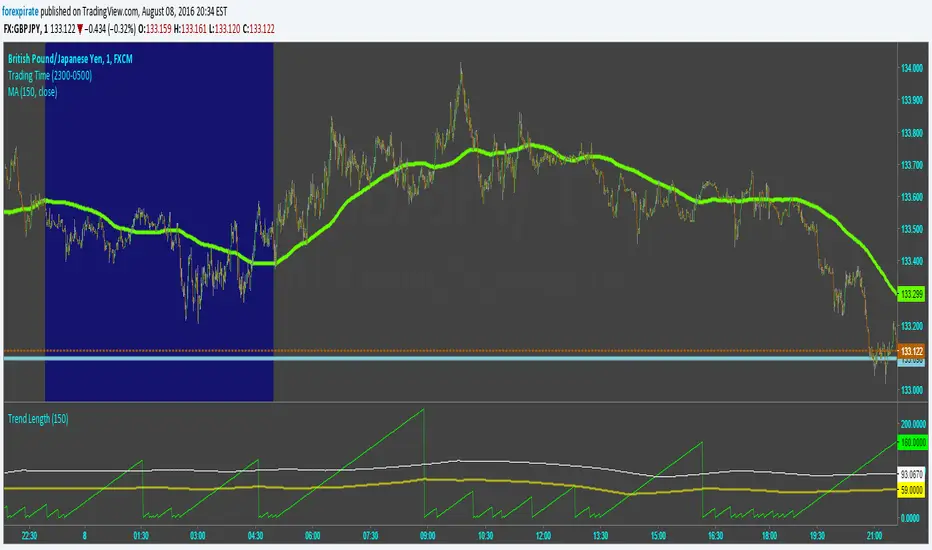
Script tries to capture the length of trends. It calculates an SMA and then determines the slope of the SMA using a simple momentum function. From there it counts bars from when the slope changed directions last. The lime green line is the count from when the slope changed. The yellow line is the average time of a trend. The white line is "trying" to capture the length of a full healthy pip running trend. Pick and SMA you like and then run through many currencies. I find that trends tend to be the same length. Not surprising as the markets are extremely correlated to each other. The trick is to find the most active pair for action. To do that look up my Pairs Range script.
Comments are welcome.
Comments are welcome.
Skrip sumber terbuka
Dalam semangat TradingView sebenar, pencipta skrip ini telah menjadikannya sumber terbuka, jadi pedagang boleh menilai dan mengesahkan kefungsiannya. Terima kasih kepada penulis! Walaupuan anda boleh menggunakan secara percuma, ingat bahawa penerbitan semula kod ini tertakluk kepada Peraturan Dalaman.
Penafian
Maklumat dan penerbitan adalah tidak bertujuan, dan tidak membentuk, nasihat atau cadangan kewangan, pelaburan, dagangan atau jenis lain yang diberikan atau disahkan oleh TradingView. Baca lebih dalam Terma Penggunaan.