PROTECTED SOURCE SCRIPT
Telah dikemas kini Simple Turnover with TOMCAP
Overview
Turnover, or the total value traded over a given period, helps you gauge whether there’s enough liquidity in the instrument being traded. This indicator calculates the average turnover and presents it as a bar-by-bar plot. It also calculates the turnover-to-market capitalization (Tomcap) ratio, and presents this in a configurable table or text summary.
Introduction
Volume indicates the total number of shares that have been bought or sold in a specific period or during the trading day.
A company's market capitalization at any given time can be determined by multiplying its stock price by the number of shares outstanding.
Share turnover is a measure of stock liquidity, calculated by dividing the total number of shares traded during some period by the average number of shares outstanding for the same period. The higher the share turnover, the more liquid company shares are.
Compared to traditional volumes, potting the change in turnover can provide a better representation of the flow of money.
At its simplest, the daily turnover on each bar is computed as the closing price for a stock multiplied by its average volume:
Pine Script®
The script calculates this by using average prices for both:
Pine Script®
Script Basics
The script computes & plots the n-period average turnover by multiplying the moving average of price and volume.
By default, the market cap is plotted bar by bar as a background behind the turnover bars.
Every time the turnover reaches a new high in a quarter, the color of the turnover bars turns dark green. This represents the HTQ (Highest Turnover in a Quarter), and multiple consecutive HTQs indicate a significant influx of funds into that stock.

Uses
The primary purpose of the script is to assist traders in making more informed decisions regarding stock selection.
1. Screen out non-tradable stocks
Quickly spot low-turnover names (illiquid stocks) to avoid wide spreads. Filter out any stocks whose average daily turnover is below, say, ₹5 Cr. This helps in eliminating tickers whose average turnover never clears your minimum threshold.
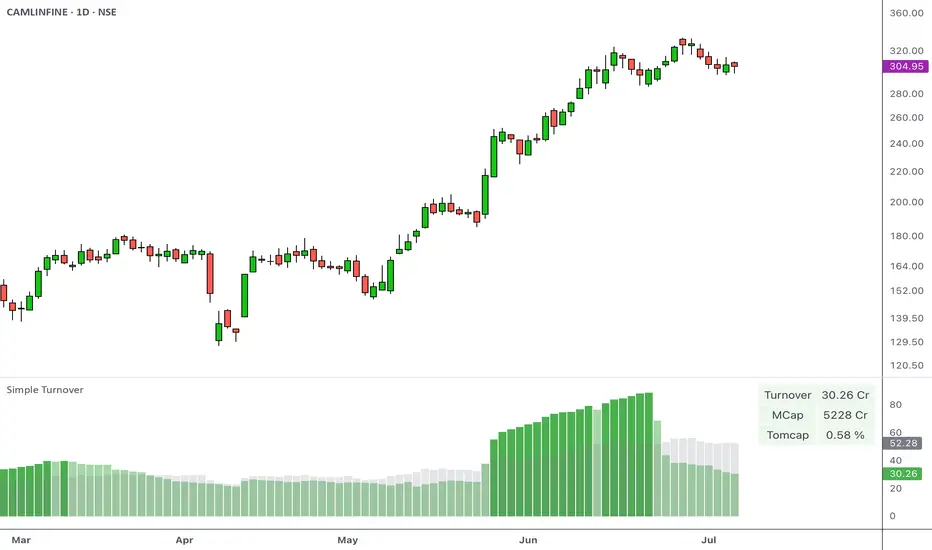
Example of a high-turnover stock:

Example of a low-turnover stock:

2. Turnover expansion
Observe when the average turnover suddenly expands from its previously subdued values. This occurs when money begins to flow in due to a catalyst, sectoral push, news flow, or any institutional activity.
Example:

3. Relative liquidity comparison
Even average turnover can sometimes overlook the context if we don’t know the company's size. That’s why the script also measures:
Turnover vs. Market cap (TOMCAP), answering “What percent of the company’s value trades each day?”
Turnover vs. Free Float (TOFF), showing liquidity against shares actually available for trading.
For example:
Customization

A. Appearance
Dark Mode toggle switches colors to match your dark layout
Show turnover in Crores or Millions
B. What to show
Select the table size and position (e.g., top-left, bottom-center)
Under Table Settings, enable or disable any row:
C. Display mode
Table: a multi-row grid with colored cells
Text: a single summary string
Turnover, or the total value traded over a given period, helps you gauge whether there’s enough liquidity in the instrument being traded. This indicator calculates the average turnover and presents it as a bar-by-bar plot. It also calculates the turnover-to-market capitalization (Tomcap) ratio, and presents this in a configurable table or text summary.
Introduction
Volume indicates the total number of shares that have been bought or sold in a specific period or during the trading day.
A company's market capitalization at any given time can be determined by multiplying its stock price by the number of shares outstanding.
Share turnover is a measure of stock liquidity, calculated by dividing the total number of shares traded during some period by the average number of shares outstanding for the same period. The higher the share turnover, the more liquid company shares are.
Compared to traditional volumes, potting the change in turnover can provide a better representation of the flow of money.
At its simplest, the daily turnover on each bar is computed as the closing price for a stock multiplied by its average volume:
turnover = volume * close / 10000000
The script calculates this by using average prices for both:
turnover = sma_volume * sma_close / 10000000
Script Basics
The script computes & plots the n-period average turnover by multiplying the moving average of price and volume.
By default, the market cap is plotted bar by bar as a background behind the turnover bars.
Every time the turnover reaches a new high in a quarter, the color of the turnover bars turns dark green. This represents the HTQ (Highest Turnover in a Quarter), and multiple consecutive HTQs indicate a significant influx of funds into that stock.
Uses
The primary purpose of the script is to assist traders in making more informed decisions regarding stock selection.
1. Screen out non-tradable stocks
Quickly spot low-turnover names (illiquid stocks) to avoid wide spreads. Filter out any stocks whose average daily turnover is below, say, ₹5 Cr. This helps in eliminating tickers whose average turnover never clears your minimum threshold.
Example of a high-turnover stock:
Example of a low-turnover stock:
2. Turnover expansion
Observe when the average turnover suddenly expands from its previously subdued values. This occurs when money begins to flow in due to a catalyst, sectoral push, news flow, or any institutional activity.
Example:
3. Relative liquidity comparison
Even average turnover can sometimes overlook the context if we don’t know the company's size. That’s why the script also measures:
Turnover vs. Market cap (TOMCAP), answering “What percent of the company’s value trades each day?”
Turnover vs. Free Float (TOFF), showing liquidity against shares actually available for trading.
For example:
- A small-cap stock with ₹1 Cr turnover but only ₹50 Cr market cap (Tomcap = 2 %)
- vs. a large-cap with ₹10 Cr turnover and ₹20,000 Cr cap (Tomcap = 0.05 %)
Customization
A. Appearance
Dark Mode toggle switches colors to match your dark layout
Show turnover in Crores or Millions
B. What to show
Select the table size and position (e.g., top-left, bottom-center)
Under Table Settings, enable or disable any row:
- Turnover
- Mcap (market capitalization)
- FF (free float)
- 1-Min liquidity (average turnover on 1-min bars)
- Tomcap (Turnover to market capitalization) or Toff (Turnover to Free Float) ratio
C. Display mode
Table: a multi-row grid with colored cells
Text: a single summary string
Nota Keluaran
- Choice of plotting either the marketcap or the freefloat as the background
- Improved table settings
- Fixed NAN% errors in the table
- Fixed a bug where the turnover did not get calculated as per the VWAP
Nota Keluaran
Fixed a bug in the calculation of one-minute liquiditySkrip dilindungi
Skrip ini diterbitkan sebagai sumber tertutup. Akan tetapi, anda boleh menggunakannya secara bebas dan tanpa apa-apa had – ketahui lebih di sini.
Penafian
Maklumat dan penerbitan adalah tidak bertujuan, dan tidak membentuk, nasihat atau cadangan kewangan, pelaburan, dagangan atau jenis lain yang diberikan atau disahkan oleh TradingView. Baca lebih dalam Terma Penggunaan.
Skrip dilindungi
Skrip ini diterbitkan sebagai sumber tertutup. Akan tetapi, anda boleh menggunakannya secara bebas dan tanpa apa-apa had – ketahui lebih di sini.
Penafian
Maklumat dan penerbitan adalah tidak bertujuan, dan tidak membentuk, nasihat atau cadangan kewangan, pelaburan, dagangan atau jenis lain yang diberikan atau disahkan oleh TradingView. Baca lebih dalam Terma Penggunaan.