OPEN-SOURCE SCRIPT
Telah dikemas kini Chips Average Line (volume price) by RSU
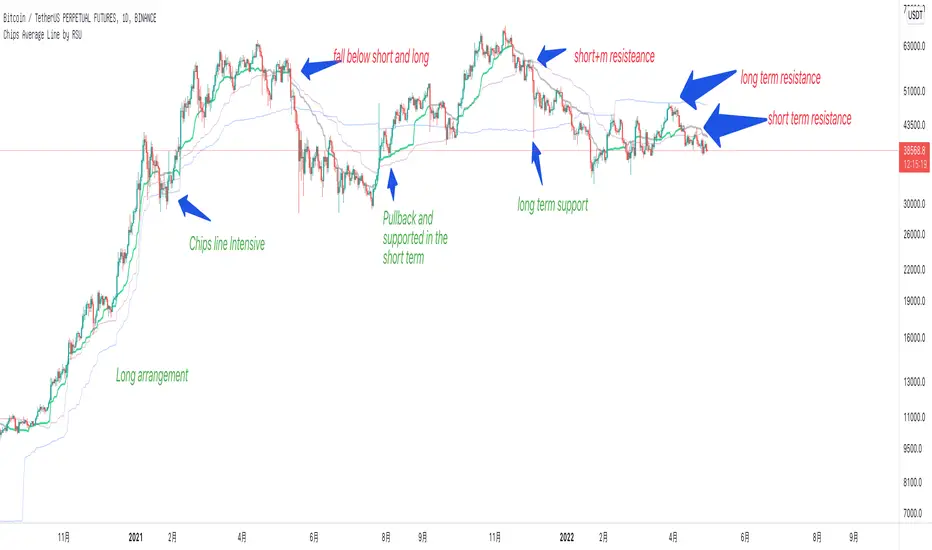
This is a very important volume-price indicator for me.
Displays the average cost of chips for the short term (30 days), medium term (60 days), and long term (200 days).
Chip lines act as support and resistance. The longer the trend days, the greater the strength.
usage:
1. Breakout: If the stock rises, it must be above the short-term chip line. And gradually rise.
2. Sequence: When a bullish trend is formed, the short-term stack is higher than the mid-term stack, and the mid-flag stack is higher than the long-term stack. When there is a bear trend, the order is reversed.
3. Intensive: When the three chip lines are dense, there will be a periodical resonance effect, and the long-term trend will rise or fall sharply
Nota Keluaran
Added smoothing parameter to reduce the jaggedness of the indicator.Nota Keluaran
Changes:All timeframes are supported.Skrip sumber terbuka
Dalam semangat TradingView sebenar, pencipta skrip ini telah menjadikannya sumber terbuka, jadi pedagang boleh menilai dan mengesahkan kefungsiannya. Terima kasih kepada penulis! Walaupuan anda boleh menggunakan secara percuma, ingat bahawa penerbitan semula kod ini tertakluk kepada Peraturan Dalaman.
Penafian
Maklumat dan penerbitan adalah tidak bertujuan, dan tidak membentuk, nasihat atau cadangan kewangan, pelaburan, dagangan atau jenis lain yang diberikan atau disahkan oleh TradingView. Baca lebih dalam Terma Penggunaan.
Skrip sumber terbuka
Dalam semangat TradingView sebenar, pencipta skrip ini telah menjadikannya sumber terbuka, jadi pedagang boleh menilai dan mengesahkan kefungsiannya. Terima kasih kepada penulis! Walaupuan anda boleh menggunakan secara percuma, ingat bahawa penerbitan semula kod ini tertakluk kepada Peraturan Dalaman.
Penafian
Maklumat dan penerbitan adalah tidak bertujuan, dan tidak membentuk, nasihat atau cadangan kewangan, pelaburan, dagangan atau jenis lain yang diberikan atau disahkan oleh TradingView. Baca lebih dalam Terma Penggunaan.