PROTECTED SOURCE SCRIPT
Telah dikemas kini Black Box Trading Measuring Tool (BlackBox - BBT)
Overview
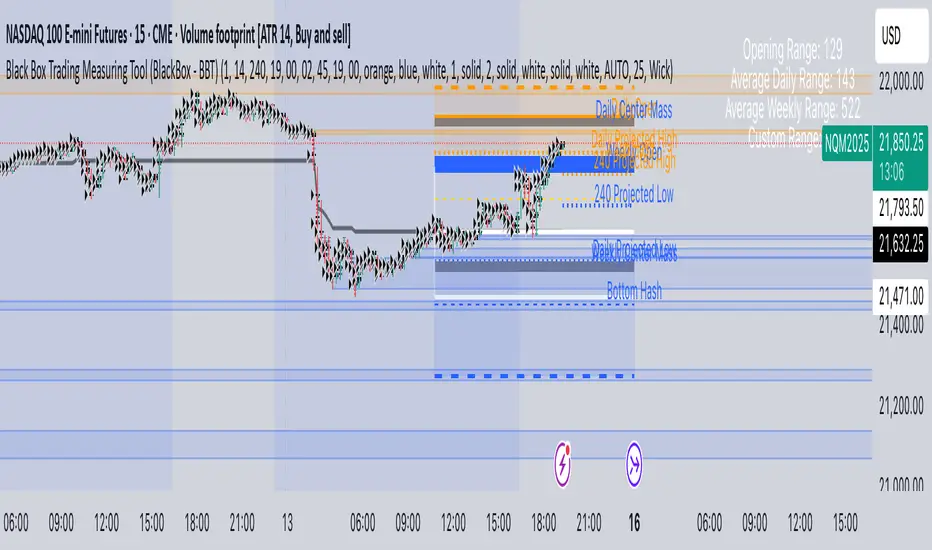
The Black Box Trading Indicator is a comprehensive technical analysis tool that combines multiple trading concepts into a single, powerful indicator. It displays custom session ranges, Average Daily Range (ADR) projections, support/resistance levels, and order blocks to help traders identify key market levels and potential trading opportunities.
Key Features
1. Custom Session Ranges
Define and visualize any trading session with customizable start and end times
Automatically calculates session high, low, and midpoint
Displays quarter levels (25% and 75% of range)
Shows range projections at 100%, 150%, 200%, and 250% extensions
2. Average Daily Range (ADR) Analysis
Calculates and displays ADR for daily, weekly, monthly, and custom timeframes
Shows projected high and low targets based on ADR
Includes "hash" levels at 50% ADR from session midpoint
Visual range boxes highlight potential support/resistance zones
3. Market Structure Levels
Daily and weekly opening prices with dynamic coloring
Previous daily and weekly center mass (50% of previous period's range)
Real-time range statistics displayed in an information table
4. Order Block Detection
Automatically identifies bullish and bearish order blocks
Visual representation with customizable colors and transparency
Mitigation tracking to remove invalidated blocks
Alert system for price interaction with order blocks
Parameter Guide
Display Settings
Show Blocks
Enables/disables order block visualization
Useful for cleaner charts when focusing on other elements
Show Previous Daily/Weekly Center Mass
Displays the midpoint of the previous period's range
Helps identify potential support/resistance from prior price acceptance areas
Show Daily/Weekly Open
Shows opening prices with color coding (blue for bullish, orange for bearish)
Important reference points for intraday trading
Show ADR Targets
Displays projected highs and lows based on Average Daily Range
Essential for setting realistic profit targets and stop losses
Show Range Projection
Extends the session range by multiples (1x, 1.5x, 2x, 2.5x)
Helps identify potential price targets during trending moves
Show Average Daily Range
Displays the ADR statistics table
Shows current range metrics for multiple timeframes
Display range in pips
Converts range values to pips for forex traders
Provides standardized measurement across different instruments
ADR Configuration
ADR Days
Number of days to include in current ADR calculation
Default: 1 (shows today's developing range)
ADR Period
Lookback period for calculating average range
Default: 14 days (standard period for volatility measurement)
Custom Range
Select between 60-minute or 240-minute timeframes
Allows analysis of intermediate timeframes
Session Time Settings (EST)
Start Hour/Minute
Define when your custom session begins
Default: 19:00 EST (Asian session open)
End Hour/Minute
Define when your custom session ends
Default: 02:45 EST (London session approach)
Extend To Hour/Minute
How far to extend the horizontal lines
Default: 19:00 EST (full 24-hour extension)
Visual Customization
Color Settings
Top Color: Used for upper levels and bullish projections
Bottom Color: Used for lower levels and bearish projections
Range Outline Color: Main session range boundaries
Center Range Line Color: Session midpoint visualization
Line Settings
Range Outline Width: Thickness of range box borders
Session Line Width: Thickness of horizontal level lines
Line Styles: Choose between solid, dashed, or dotted
Text Settings
Text Color: Color for all labels
Text Size: AUTO, tiny, small, normal, or large
Order Block Settings
Sensitivity
Percentage threshold for order block detection (1-100)
Higher values = fewer but stronger blocks
Default: 25 (detects 25% price movements)
OB Mitigation Type
Close: Block is mitigated when price closes beyond it
Wick: Block is mitigated when price wicks beyond it
Color Configuration
Separate colors for bullish and bearish blocks
Border and background colors can be customized independently
Trading Applications
1. Session-Based Trading
Identify the initial balance (first hour of trading)
Trade breakouts from defined session ranges
Use range projections for profit targets
Monitor for range-bound vs trending conditions
2. ADR-Based Strategies
Set daily profit targets based on ADR projections
Identify overextended moves when price exceeds ADR
Use ADR levels for position sizing and risk management
Compare current range to average for volatility assessment
3. Support/Resistance Trading
Use previous period center mass as dynamic S/R
Trade bounces from daily/weekly opens
Combine multiple timeframe levels for confluence
Monitor order blocks for potential reversal zones
4. Order Block Trading
Enter trades when price returns to unmitigated blocks
Use blocks as stop loss placement guides
Look for confluence with other indicator levels
Monitor block mitigation for trend confirmation
Best Practices
1. Multi-Timeframe Analysis
Use higher timeframe blocks for major levels
Combine with lower timeframe entries
Monitor weekly levels on daily charts
2. Confluence Trading
Look for areas where multiple levels align
Combine order blocks with ADR targets
Use session ranges with center mass levels
3. Risk Management
Use ADR for realistic daily profit targets
Place stops beyond order blocks or range extremes
Size positions based on distance to key levels
4. Alert Usage
Set alerts for ADR target hits
Monitor order block interactions
Track range breakouts and hash level tests
Tips for Effective Use
Start Simple: Begin with basic session ranges and ADR before adding all features
Color Coding: Use consistent colors across your trading setup
Time Zones: Ensure session times match your trading schedule
Clean Charts: Toggle off unused features for clarity
Backtesting: Study how price respects these levels historically
Journaling: Document which levels work best for your traded instruments
Common Trading Scenarios
Range Trading
Enter longs at session low or lower projections
Enter shorts at session high or upper projections
Target the session midpoint or opposite extreme
Breakout Trading
Wait for clear breaks of session range
Use range width for measuring targets
Monitor ADR to gauge breakout potential
Trend Following
Use order blocks as pullback entries
Trail stops using range projections
Scale out at ADR targets
Reversal Trading
Look for price rejection at ADR extremes
Monitor order block mitigation failures
Use center mass as reversal confirmation
Nota Keluaran
Swing Trading Strategies Using Black Box Trading IndicatorStrategy 1: Weekly Range Breakout System
Setup
Timeframe: Daily chart
Session Settings: Set to weekly range (Monday 00:00 to Friday 23:59)
Key Levels: Weekly high/low, weekly center mass, ADR projections
Entry Rules
Long Entry:
Wait for price to break above weekly high with daily close
Confirm weekly ADR hasn't been exhausted (price below weekly projected high)
Enter on retest of broken weekly high or at weekly center mass
Short Entry:
Wait for price to break below weekly low with daily close
Confirm weekly ADR hasn't been exhausted (price above weekly projected low)
Enter on retest of broken weekly low or at weekly center mass
Exit Rules
Target 1: Weekly ADR projection (50% position)
Target 2: 1.5x weekly range extension (remaining position)
Stop Loss: Below/above weekly center mass or entry order block
Risk Management
Risk 1-2% per trade
Only take trades when weekly range is within 20% of average weekly ADR
Strategy 2: Order Block Accumulation Method
Setup
Timeframe: 4-hour and daily charts
Order Block Sensitivity: 30-40 (higher for cleaner signals)
Focus: Unmitigated order blocks on daily timeframe
Entry Rules
Long Entry:
Identify bullish order block on daily chart
Wait for price to return to block after initial move away
Confirm with 4H bullish market structure (higher highs/lows)
Enter when price touches order block with bullish reaction
Short Entry:
Identify bearish order block on daily chart
Wait for price to return to block after initial move away
Confirm with 4H bearish market structure (lower highs/lows)
Enter when price touches order block with bearish reaction
Exit Rules
Target 1: Previous swing high/low (50% position)
Target 2: Daily ADR projection or next major order block
Stop Loss: Beyond order block range (use 1.5x block height)
Trade Management
Move stop to breakeven after Target 1
Trail stop using 4H order blocks
Hold maximum 5-10 days
Strategy 3: ADR Exhaustion Reversal
Setup
Timeframe: Daily chart with 4H confirmation
Key Indicators: Daily/Weekly ADR projections
Best Markets: Ranging or weak trending conditions
Entry Rules
Long Entry:
Price reaches daily projected low (100% ADR down)
Weekly ADR shows less than 70% exhaustion
Price shows rejection (pin bar, engulfing) at level
Enter on 4H close back inside daily ADR range
Short Entry:
Price reaches daily projected high (100% ADR up)
Weekly ADR shows less than 70% exhaustion
Price shows rejection at level
Enter on 4H close back inside daily ADR range
Exit Rules
Target 1: Daily center mass/50% ADR (50% position)
Target 2: Opposite ADR extreme or weekly center mass
Stop Loss: 20% beyond ADR projection
Filters
Avoid during strong trending markets (weekly close beyond ADR)
Best during consolidation phases
Check monthly ADR for additional context
Strategy 4: Multi-Timeframe Center Mass Confluence
Setup
Timeframe: Daily chart
Key Levels: Daily, weekly, and monthly center mass
Additional: Order blocks for confirmation
Entry Rules
Long Entry:
Price pulls back to area where 2+ center mass levels converge
Bullish order block present at confluence zone
Price shows bullish structure on 4H (higher low)
Enter on daily close above confluence area
Short Entry:
Price rallies to area where 2+ center mass levels converge
Bearish order block present at confluence zone
Price shows bearish structure on 4H (lower high)
Enter on daily close below confluence area
Exit Rules
Target 1: Next timeframe's center mass
Target 2: ADR projection in trade direction
Stop Loss: Beyond the furthest center mass level
Position Sizing
Larger position when 3 timeframes align
Reduce size if only 2 timeframes converge
Strategy 5: Range Projection Momentum
Setup
Timeframe: Daily and 4H charts
Session: Custom 3-day range
Key Tool: Range projections (100%, 150%, 200%)
Entry Rules
Long Entry:
Price breaks above 3-day range high with momentum
Daily close above range high
Enter on retest of range high or at 100% projection
ADR supports further movement (less than 60% used)
Short Entry:
Price breaks below 3-day range low with momentum
Daily close below range low
Enter on retest of range low or at 100% projection
ADR supports further movement
Exit Rules
Target 1: 150% range projection (50% position)
Target 2: 200% range projection or weekly ADR limit
Stop Loss: Back inside range midpoint
Trade Management
Scale out at each projection level
Use 4H order blocks to trail stops
Maximum hold time: 7 trading days
Strategy 6: Weekly Open Reversion
Setup
Timeframe: Daily and 4H charts
Key Level: Weekly open price
Supporting Levels: Order blocks, ADR levels
Entry Rules
Long Entry:
Price moves below weekly open by 50-100% of daily ADR
Bullish order block forms on 4H below weekly open
Price reclaims weekly open with 4H close
Enter on retest of weekly open from above
Short Entry:
Price moves above weekly open by 50-100% of daily ADR
Bearish order block forms on 4H above weekly open
Price loses weekly open with 4H close
Enter on retest of weekly open from below
Exit Rules
Target 1: Previous week's high/low (50% position)
Target 2: Weekly ADR projection
Stop Loss: Beyond triggering order block
Best Conditions
Works best in ranging markets
Avoid during strong weekly trends
Most effective Tuesday-Thursday
Pro Tips for All Strategies
1. Market Condition Filters
Use monthly ADR to gauge overall volatility
Avoid reversal strategies in strong trends
Prefer breakout strategies when weekly range is narrow
2. Time-Based Filters
Best entries Tuesday-Thursday
Avoid Mondays and Fridays for new positions
Consider economic calendar for volatility
3. Risk Management Rules
Never risk more than 2% per trade
Limit to 2-3 open swing positions
Use correlation analysis for portfolio risk
4. Optimization Tips
Backtest sensitivity settings for your markets
Adjust ADR period based on market volatility
Fine-tune session times for your instruments
5. Combining Strategies
Use ADR exhaustion for entries, order blocks for exits
Combine center mass confluence with range projections
Layer multiple timeframe analysis for confirmation
Strategy Selection Guide
Trending Markets: Use Strategy 1 (Breakout) and Strategy 5 (Momentum)
Ranging Markets: Use Strategy 3 (ADR Reversal) and Strategy 6 (Weekly Open)
All Conditions: Strategy 2 (Order Blocks) and Strategy 4 (Center Mass)
High Volatility: Focus on ADR-based strategies
Low Volatility: Focus on range and order block strategies
Nota Keluaran
colors updateNota Keluaran
Scalping Strategies Using Black Box Trading IndicatorStrategy 1: Session Range Breakout Scalp
Setup
Timeframe: 5-minute chart
Session Settings: Set to first hour of London or NY session
Key Focus: Initial Balance (IB) range and immediate breakouts
Entry Rules
Long Entry:
Wait for 5-min close above session high (first hour range)
Confirm with increased volume
Enter immediately on breakout candle close
ADR must show less than 30% exhaustion
Short Entry:
Wait for 5-min close below session low (first hour range)
Confirm with increased volume
Enter immediately on breakout candle close
ADR must show less than 30% exhaustion
Exit Rules
Target 1: 50% of session range (50% position)
Target 2: 100% of session range projection
Stop Loss: 10 pips beyond opposite side of range
Time Stop: Exit after 30 minutes if no profit
Risk Management
Risk 0.5% per trade
Maximum 3 trades per session
Stop trading if 2 consecutive losses
Strategy 2: Order Block Quick Rejection
Setup
Timeframe: 1-minute and 5-minute charts
Order Block Sensitivity: 15-20 (lower for more signals)
Session: Active market hours only
Entry Rules
Long Entry:
Identify fresh bullish order block on 5-min
Price returns to block within 10 candles
1-min shows immediate rejection (wick/pin bar)
Enter on 1-min close above block high
Short Entry:
Identify fresh bearish order block on 5-min
Price returns to block within 10 candles
1-min shows immediate rejection
Enter on 1-min close below block low
Exit Rules
Target: 15-20 pips or previous 5-min swing
Stop Loss: 5 pips beyond order block
Trail: Move stop to breakeven at 10 pips profit
Trade Management
One trade per order block only
Skip if price consolidates in block over 5 candles
Exit if price doesn't move within 10 minutes
Strategy 3: ADR Hash Level Bounce
Setup
Timeframe: 5-minute chart
Key Levels: Daily hash levels (50% ADR from midpoint)
Best Time: 30 minutes after session open
Entry Rules
Long Entry:
Price touches bottom hash level (first touch of day)
5-min candle shows rejection (lower wick)
Next candle breaks high of rejection candle
Enter on break with momentum
Short Entry:
Price touches top hash level (first touch of day)
5-min candle shows rejection (upper wick)
Next candle breaks low of rejection candle
Enter on break with momentum
Exit Rules
Target 1: Session midpoint (70% position)
Target 2: Opposite hash level
Stop Loss: 10 pips beyond hash level
Quick Exit: If no movement in 15 minutes
Filters
Only first touch of day
Skip if price gaps through level
Avoid during news events
Strategy 4: Range Midpoint Reversion Scalp
Setup
Timeframe: 3-minute chart
Session: Custom 2-hour range
Key Level: Session midpoint and quarter levels
Entry Rules
Long Entry:
Price moves to lower quarter (25%) of range
Shows rejection within 2 candles
Breaks above rejection high
Midpoint hasn't been tested in last hour
Short Entry:
Price moves to upper quarter (75%) of range
Shows rejection within 2 candles
Breaks below rejection low
Midpoint hasn't been tested in last hour
Exit Rules
Target: Session midpoint (full position)
Stop Loss: Beyond session extreme
Breakeven: At 50% of target distance
Time Exit: 20 minutes maximum
Position Management
Scale out 50% at halfway point
Move stop to breakeven
Let remainder run to midpoint
Strategy 5: Opening Drive Continuation
Setup
Timeframe: 1-minute and 5-minute charts
Time: First 30 minutes of London/NY session
Tools: Previous day's high/low, overnight range
Entry Rules
Long Entry:
Price breaks above previous day high in first 15 min
1-min pullback to broken level (2-5 candles)
Bullish order block forms at retest
Enter on 1-min close above pullback high
Short Entry:
Price breaks below previous day low in first 15 min
1-min pullback to broken level (2-5 candles)
Bearish order block forms at retest
Enter on 1-min close below pullback low
Exit Rules
Target 1: 20 pips (50% position)
Target 2: 50% daily ADR projection
Stop Loss: 10 pips
Trail: 10-pip trailing stop after Target 1
Trade Filters
Only one trade per session
Skip if overnight range exceeds 50% of daily ADR
Avoid if gap is larger than 20 pips
Strategy 6: Micro Range Breakout
Setup
Timeframe: 1-minute chart
Range Period: 15-minute micro ranges
Best Sessions: High volatility periods
Entry Rules
Long Entry:
Identify 15-min consolidation (range < 15 pips)
Mark range high/low on 1-min chart
Enter on 1-min close above range high
Volume must increase on breakout
Short Entry:
Identify 15-min consolidation
Mark range high/low on 1-min chart
Enter on 1-min close below range low
Volume must increase on breakout
Exit Rules
Target: 100% of range size
Stop Loss: Middle of consolidation range
Quick Stop: Exit if price returns to range within 3 candles
Range Requirements
Minimum 5 pips, maximum 15 pips range
At least 10 candles of consolidation
Clear boundaries (2+ touches each side)
Strategy 7: News Fade Using ADR
Setup
Timeframe: 1-minute and 5-minute charts
Time: 5-30 minutes after major news
Key Levels: ADR projections and hash levels
Entry Rules
Long Entry (Fade down move):
News causes spike down to/beyond daily projected low
Price shows exhaustion (multiple 1-min wicks)
5-min candle closes back inside ADR range
Enter on retest of daily projected low from above
Short Entry (Fade up move):
News causes spike up to/beyond daily projected high
Price shows exhaustion
5-min candle closes back inside ADR range
Enter on retest of daily projected high from below
Exit Rules
Target 1: Hash level (50% position)
Target 2: Session midpoint or center mass
Stop Loss: 15 pips beyond ADR projection
Maximum Time: 45 minutes
Risk Controls
Only trade high-impact news
Wait minimum 5 minutes after release
One trade per news event
Advanced Scalping Tips
1. Time-Based Optimization
Best Hours: First 2 hours of London/NY
Avoid: Lunch hours (12-1 PM EST)
Friday: Reduce position size by 50%
2. Multi-Timeframe Confirmation
Always check 15-min order blocks
Confirm trend on hourly chart
Use 1-min for precise entries only
3. Speed of Execution
Use hotkeys for entries/exits
Pre-set stop loss and take profit
Have emergency flatten button ready
4. Scalping-Specific Settings
Order Block Sensitivity: 10-20
Tighter session ranges (30-60 min)
Focus on quarter levels for quick bounces
5. Risk Management Rules
Maximum 5 trades per day
Stop after 3 consecutive losses
Daily loss limit: 2% of account
Win rate target: >65%
Quick Reference Decision Tree
Market Open (First 30 min)
Gap Up/Down → Strategy 5 (Opening Drive)
Narrow Range → Strategy 1 (IB Breakout)
Trending → Strategy 2 (Order Block Rejection)
Mid-Session
Ranging → Strategy 4 (Midpoint Reversion)
Consolidating → Strategy 6 (Micro Breakout)
At ADR Levels → Strategy 3 (Hash Bounce)
News Events
Always → Strategy 7 (News Fade)
Then → Return to normal strategies
Skrip dilindungi
Skrip ini diterbitkan sebagai sumber tertutup. Akan tetapi, anda boleh menggunakannya secara bebas dan tanpa apa-apa had – ketahui lebih di sini.
Penafian
Maklumat dan penerbitan adalah tidak bertujuan, dan tidak membentuk, nasihat atau cadangan kewangan, pelaburan, dagangan atau jenis lain yang diberikan atau disahkan oleh TradingView. Baca lebih dalam Terma Penggunaan.