OPEN-SOURCE SCRIPT
Telah dikemas kini Nifty TOP 10 Puller and Drggaers by Dee
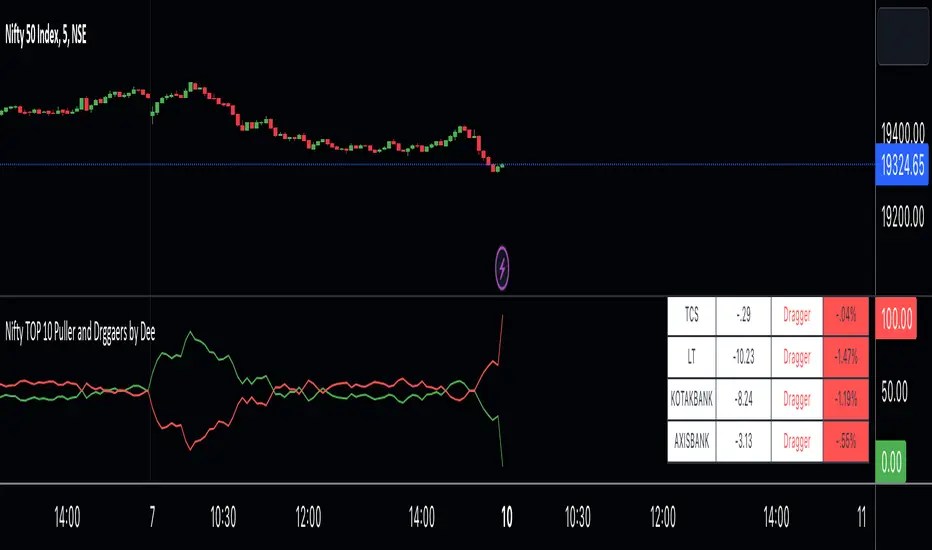
hi guys this is a straightforward indicator that shows the top 10 nitty pullers and dragger
How to use it ?
in the table, you can see the values of each puller and dragger well as their contribution amount and it will show if they puller or dragger
graph shows the puller and dragger using a line
both have max 100 points allocated
if they exceed the 100 points then a line will struck their ( point to remember ) it does not glitch
so it will give Ruf idea of who is strong
if buyers are strong then the green lien will always be upside
if sellers are string then the red line will always be upside
*Cross Over *
there are 2 types of cross over 1 is bull cross over other is bear cross over
when bulls are strong they will cross over the red from the bottom it showing that significantly strong
when bear is strong they will cross over the green from the bottom it shows that bear is significantly strong
hope you understand how to use it
we have limitation in trading view so we choose only 10 stock to calculate the %
Nota Keluaran
Thanks to d.umesh sir for letting me know the bug table position bug has been fixed now .now it work fine
added more table position option for the placement ..
Nota Keluaran
You now have the ability to modify the weight of each individual stock, and all minor bugs have been resolved.now you can change weight of each and every stocks and small bugs has been fixed Nota Keluaran
now you can add or remove any stock and its weights for eg if hdfc is removed and one stock has been added then u can remove hdfc and add new stock ...Skrip sumber terbuka
Dalam semangat TradingView sebenar, pencipta skrip ini telah menjadikannya sumber terbuka, jadi pedagang boleh menilai dan mengesahkan kefungsiannya. Terima kasih kepada penulis! Walaupuan anda boleh menggunakan secara percuma, ingat bahawa penerbitan semula kod ini tertakluk kepada Peraturan Dalaman.
Penafian
Maklumat dan penerbitan adalah tidak bertujuan, dan tidak membentuk, nasihat atau cadangan kewangan, pelaburan, dagangan atau jenis lain yang diberikan atau disahkan oleh TradingView. Baca lebih dalam Terma Penggunaan.
Skrip sumber terbuka
Dalam semangat TradingView sebenar, pencipta skrip ini telah menjadikannya sumber terbuka, jadi pedagang boleh menilai dan mengesahkan kefungsiannya. Terima kasih kepada penulis! Walaupuan anda boleh menggunakan secara percuma, ingat bahawa penerbitan semula kod ini tertakluk kepada Peraturan Dalaman.
Penafian
Maklumat dan penerbitan adalah tidak bertujuan, dan tidak membentuk, nasihat atau cadangan kewangan, pelaburan, dagangan atau jenis lain yang diberikan atau disahkan oleh TradingView. Baca lebih dalam Terma Penggunaan.