OPEN-SOURCE SCRIPT
Telah dikemas kini MA Trends — mura vision
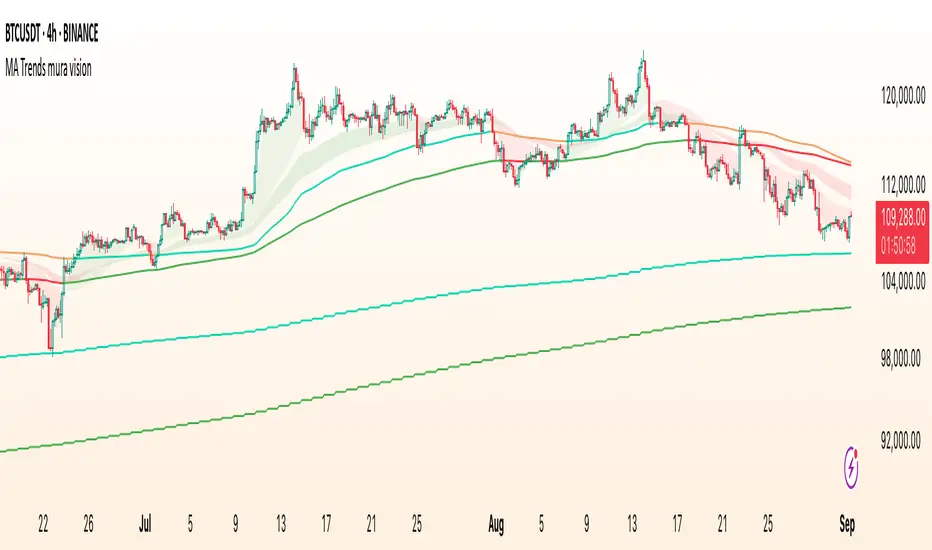
MA Trends — mura vision is a multi-timeframe trend map that blends two local trend “ribbons” on the current timeframe with higher-timeframe context lines. It helps you read market bias at a glance and align entries with the dominant trend.
What the indicator plots
On the current timeframe
Higher-timeframe context
Optional (disabled by default)
EMA 233 & KAMA 233 on the current TF — toggle on if you want the same 233 anchors on the chart’s timeframe.
Note: All higher-TF series are requested viaPine Script® with Pine Script® .
How to read it
1 Bias: Use the 4H/1D EMA/KAMA 233 as dynamic anchors.
• Green = price is above the anchor on that HTF (supportive context).
• Red = price is below the anchor on that HTF (resistive context).
2 Alignment: When both ribbons are green (SMA5>34 and EMA55>89) while HTF anchors are green, momentum and context agree (higher-quality trend). The opposite coloring suggests bearish alignment.
3 Pullbacks: Retracements toward the ribbon edges often act as retest zones within the prevailing regime.
Inputs & customization
SMA 5/34 (current TF), EMA 55/89 (current TF), EMA/KAMA 233 for 4H, 1D, and current TF (the latter are off by default).
Lines for SMA5/SMA34 and EMA55/EMA89 (plotted with high transparency), fill colors for up/down trend ribbons, and separate support/resistance colors for EMA/KAMA 233.
MTF behavior & repainting notes
Good practices
What this script is / isn’t
Credits & license
Disclaimer
Trading involves risk. This indicator is provided “as is” for informational/educational use only and is not financial advice. Always test on historical data and use proper risk management.
What the indicator plots
On the current timeframe
- SMA 5/34 — short-term trend ribbon (filled area between SMA5 and SMA34).
- EMA 55/89 — swing trend ribbon (filled area between EMA55 and EMA89).
Higher-timeframe context
- EMA 233 (4H & 1D) — plotted as lines. Color reflects whether price on the same HTF is above (support) or below (resistance).
- KAMA 233 (4H & 1D) — plotted as lines using a custom Kaufman implementation (Efficiency Ratio with fast=2, slow=30; squared smoothing). Color logic is the same as EMA 233.
Optional (disabled by default)
EMA 233 & KAMA 233 on the current TF — toggle on if you want the same 233 anchors on the chart’s timeframe.
Note: All higher-TF series are requested via
request.security()
lookahead_off
How to read it
1 Bias: Use the 4H/1D EMA/KAMA 233 as dynamic anchors.
• Green = price is above the anchor on that HTF (supportive context).
• Red = price is below the anchor on that HTF (resistive context).
2 Alignment: When both ribbons are green (SMA5>34 and EMA55>89) while HTF anchors are green, momentum and context agree (higher-quality trend). The opposite coloring suggests bearish alignment.
3 Pullbacks: Retracements toward the ribbon edges often act as retest zones within the prevailing regime.
Inputs & customization
- Visibility toggles for each block:
SMA 5/34 (current TF), EMA 55/89 (current TF), EMA/KAMA 233 for 4H, 1D, and current TF (the latter are off by default).
- Colors:
Lines for SMA5/SMA34 and EMA55/EMA89 (plotted with high transparency), fill colors for up/down trend ribbons, and separate support/resistance colors for EMA/KAMA 233.
- Line width for all 233 anchors.
MTF behavior & repainting notes
- HTF lines (4H/1D) are computed with and update intrabar until the higher-TF candle closes. This is expected on TradingView and not “future-looking”, but values can stabilize only at the close of the 4H/1D bar.
Pine Script® lookahead_off - If you require strictly confirmed HTF values, use a “previous bar” approach (e.g., plotting series[1]) — not included here to keep the display responsive.
Good practices
- Determine direction with 4H/1D EMA/KAMA 233, then refine timing with the current-TF ribbons.
- For conservative use, favor trades with the color of the dominant HTF anchor.
- Combine with your own risk management and confirmation rules.
What this script is / isn’t
- ✅ Visual analysis tool for multi-timeframe trend context.
- ❌ Not a strategy: it does not generate orders or calculate P&L.
Credits & license
- © trading_mura — Published for educational purposes under the Mozilla Public License 2.0.
- KAMA is implemented via a custom Kaufman method (ER with fast=2, slow=30, squared smoothing), not .
Pine Script® ta.kama()
Disclaimer
Trading involves risk. This indicator is provided “as is” for informational/educational use only and is not financial advice. Always test on historical data and use proper risk management.
Nota Keluaran
Made some small updatesSkrip sumber terbuka
In true TradingView spirit, the creator of this script has made it open-source, so that traders can review and verify its functionality. Kudos to the author! While you can use it for free, remember that republishing the code is subject to our House Rules.
✅My Telegram
t.me/trading_mura
t.me/trading_mura
Penafian
The information and publications are not meant to be, and do not constitute, financial, investment, trading, or other types of advice or recommendations supplied or endorsed by TradingView. Read more in the Terms of Use.
Skrip sumber terbuka
In true TradingView spirit, the creator of this script has made it open-source, so that traders can review and verify its functionality. Kudos to the author! While you can use it for free, remember that republishing the code is subject to our House Rules.
✅My Telegram
t.me/trading_mura
t.me/trading_mura
Penafian
The information and publications are not meant to be, and do not constitute, financial, investment, trading, or other types of advice or recommendations supplied or endorsed by TradingView. Read more in the Terms of Use.