OPEN-SOURCE SCRIPT
Fundamentals Panel
Fundamentals Panel Description
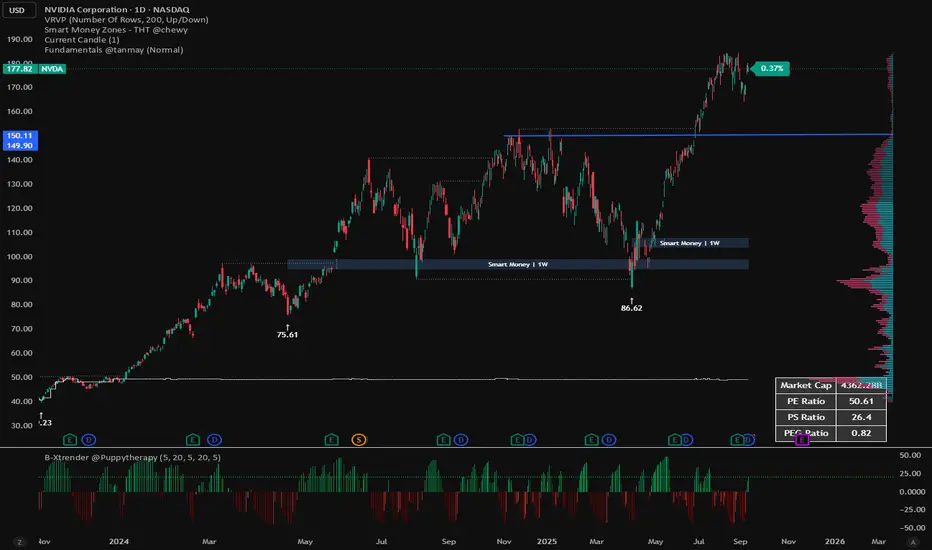
The Fundamentals Panel is a versatile Pine Script indicator that displays key financial metrics—Market Cap, P/E Ratio, P/S Ratio, and PEG Ratio—in a clean, customizable table on your TradingView chart. Designed for investors and traders, this tool brings essential company fundamentals directly to your chart, saving time and enhancing decision-making.
Quick Insights: View critical valuation metrics (Market Cap, P/E, P/S, PEG) at a glance without leaving your chart, ideal for fundamental analysis or screening stocks.
Customizable Display: Toggle each metric on or off via input settings to focus on what matters most to your strategy.
Adjustable Font Size: Choose from Small, Normal, or Large text sizes to ensure readability suits your chart setup and screen preferences.
Reliable Data: Pulls data directly from TradingView’s financial database, using diluted shares and trailing metrics for accuracy across most stocks.
Debugging Support: Includes hidden plots (visible in the Data Window) to verify raw data like shares outstanding, revenue, and PEG, helping you trust the numbers.
How It Works
The indicator fetches:
Market Cap: Calculated using diluted shares outstanding and current price.
P/E Ratio: Price divided by trailing twelve-month (TTM) diluted EPS.
P/S Ratio: Market cap divided by TTM total revenue.
PEG Ratio: Trailing PEG from TradingView’s data, with an additional calculated PEG for cross-checking.
Skrip sumber terbuka
Dalam semangat TradingView sebenar, pencipta skrip ini telah menjadikannya sumber terbuka, jadi pedagang boleh menilai dan mengesahkan kefungsiannya. Terima kasih kepada penulis! Walaupuan anda boleh menggunakan secara percuma, ingat bahawa penerbitan semula kod ini tertakluk kepada Peraturan Dalaman.
Penafian
Maklumat dan penerbitan adalah tidak bertujuan, dan tidak membentuk, nasihat atau cadangan kewangan, pelaburan, dagangan atau jenis lain yang diberikan atau disahkan oleh TradingView. Baca lebih dalam Terma Penggunaan.