OPEN-SOURCE SCRIPT
D/W/M RSI & %CHNG + ATR
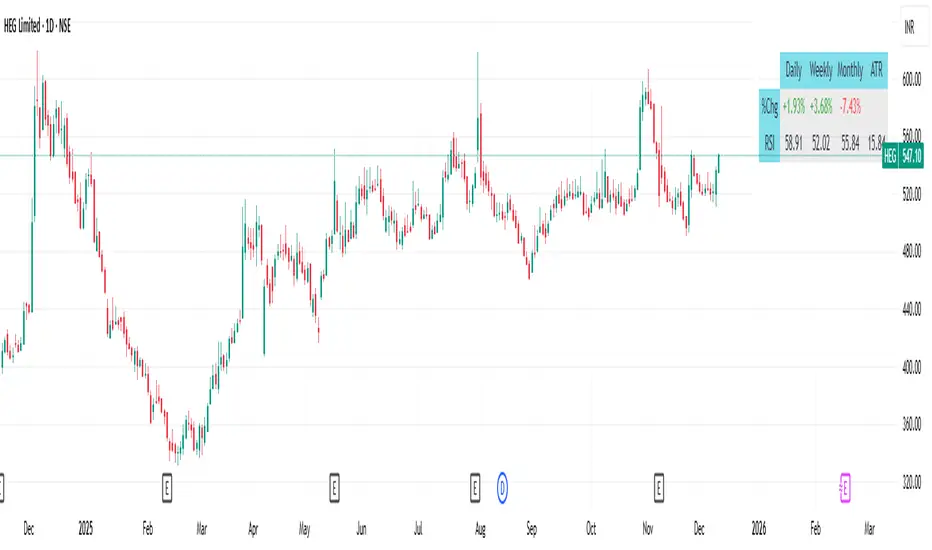
This indicator provides a comprehensive, at-a-glance dashboard displaying key technical metrics across multiple timeframes: Daily, Weekly, and Monthly. It tracks Price Change Percentage, Relative Strength Index (RSI), and Average True Range (ATR) for each timeframe, helping traders quickly assess market trends, momentum, and volatility in one view.
Key Features:
Price Change % (Daily/Weekly/Monthly):
Displays the percentage change in price over the selected timeframes, giving traders insight into short-term, medium-term, and long-term price movement trends.
Relative Strength Index (RSI):
Shows the RSI value on Daily, Weekly, and Monthly timeframes. The RSI measures momentum, indicating overbought or oversold conditions:
Average True Range (ATR):
Tracks the ATR across multiple timeframes to assess market volatility. Higher ATR values signify more significant price movement (higher volatility), while lower values suggest quieter markets.
This indicator helps traders make informed decisions by quickly visualizing price momentum, market volatility, and possible trend reversals. It's ideal for swing traders, day traders, and long-term investors who need a bird's-eye view of the market across different timeframes.
How to Use:
Add the indicator to your TradingView chart.
Review the Price Change % to see how the market is trending across the selected timeframes.
Use the RSI to identify overbought or oversold conditions.
Check the ATR to assess current market volatility and adjust position sizes accordingly.
Skrip sumber terbuka
Dalam semangat TradingView sebenar, pencipta skrip ini telah menjadikannya sumber terbuka, jadi pedagang boleh menilai dan mengesahkan kefungsiannya. Terima kasih kepada penulis! Walaupuan anda boleh menggunakan secara percuma, ingat bahawa penerbitan semula kod ini tertakluk kepada Peraturan Dalaman.
Penafian
Maklumat dan penerbitan adalah tidak bertujuan, dan tidak membentuk, nasihat atau cadangan kewangan, pelaburan, dagangan atau jenis lain yang diberikan atau disahkan oleh TradingView. Baca lebih dalam Terma Penggunaan.