PROTECTED SOURCE SCRIPT
target price with DCF method by N' TEEREX Hoonjongpang
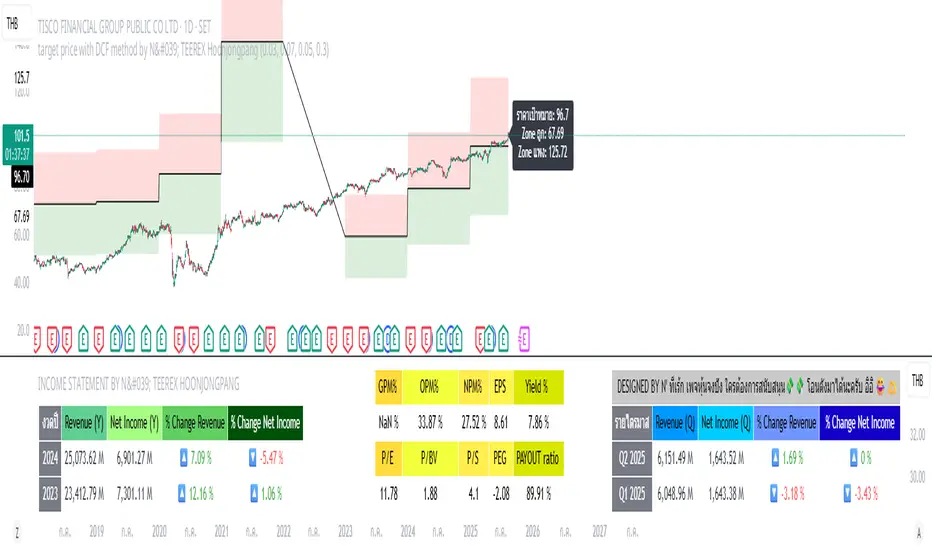
This indicator calculates a stock’s intrinsic value using the latest fiscal year data: free cash flow, debt, equity, shares outstanding, and taxes.
It computes the Weighted Average Cost of Capital (WACC), applies the Gordon Growth formula, and derives a price per share.
A margin of safety is applied to define zones on the chart:
Green Zone: Safe (undervalued)
Red Zone: Not Safe (overvalued)
All key numbers, including WACC, price target, and zones, are displayed as a label.
Result: A visual and numeric guide to the stock’s fair value, helping investors quickly see if the current price is above or below estimated intrinsic value.
Skrip dilindungi
Skrip ini diterbitkan sebagai sumber tertutup. Akan tetapi, anda boleh menggunakannya secara bebas dan tanpa apa-apa had – ketahui lebih di sini.
Penafian
Maklumat dan penerbitan adalah tidak bertujuan, dan tidak membentuk, nasihat atau cadangan kewangan, pelaburan, dagangan atau jenis lain yang diberikan atau disahkan oleh TradingView. Baca lebih dalam Terma Penggunaan.