PROTECTED SOURCE SCRIPT
Telah dikemas kini 52SIGNAL RECIPE Bid/Ask Intensity Monitor
═══ 52SIGNAL RECIPE Bid/Ask Intensity Monitor ═══
◆ Overview
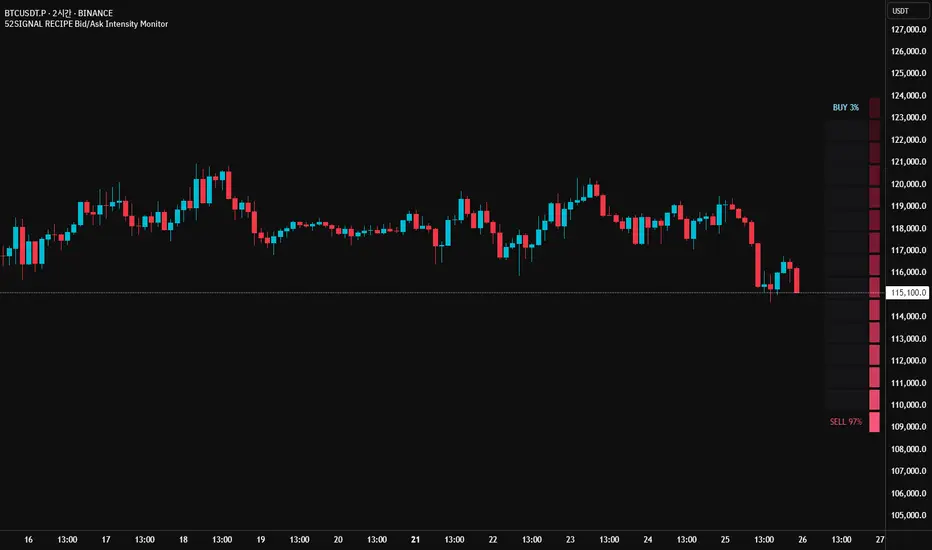
52SIGNAL RECIPE Bid/Ask Intensity Monitor is a technical indicator that visualizes the balance of buying and selling forces in the market in real-time. Based on candle structure, this indicator calculates the relative strength of buying and selling pressure, displaying it through an intuitive color gradient gauge that allows traders to instantly grasp short-term market psychology and trading activity.
─────────────────────────────────────
◆ Key Features
• Intuitive Visualization: Instantly recognize buy/sell ratios through color gradient gauges
• Real-time Force Balance: Accurately display the buy/sell force ratio as a percentage in the current candle
• Candle Structure Analysis: Interpret market participant behavior through relationships between high, low, and close prices
• Chart Overlay: Displayed on the chart to observe changes in force balance alongside price movements
• Color Psychology: Provides intuitive psychological understanding through blue series (buy) and red series (sell) colors
─────────────────────────────────────
◆ Technical Foundation
■ Buy/Sell Ratio Calculation
• Basic Principle: Measure the relative strength of buyers and sellers by analyzing candle structure
• Buy Ratio Calculation: (Close - Low) ÷ (High - Low)
• Sell Ratio Calculation: 1 - Buy Ratio
• Interpretation Logic: The closer the closing price is to the high, the stronger the buying force; the closer to the low, the stronger the selling force
■ Visualization Mechanism
• Gradient Color Map: Express buy/sell intensity through 12-level color gradients
• Buy Color Range: Gradual change from light sky blue (#8be2ff) to deep navy blue (#103c60)
• Sell Color Range: Gradual change from light pink (#f65575) to deep burgundy (#3d101a)
• Gauge Structure: Vertical table positioned in the middle right of the chart for enhanced visual focus
─────────────────────────────────────
◆ Practical Applications
■ Market Psychology Identification
• Strong Buying Pressure Signals:
▶ When buy ratio is displayed as 70% or higher
▶ When the gauge is filled with bright blue shades
• Strong Selling Pressure Signals:
▶ When sell ratio is displayed as 70% or higher
▶ When the gauge is filled with bright red shades
• Force Balance State:
▶ When buy/sell ratio is in the 40-60% range
▶ When the color distribution in the gauge is even
■ Trading Strategy Application
• Trend Confirmation Strategy:
▶ Consecutive high buy ratios (70% or more) signal uptrend confirmation
▶ Consecutive high sell ratios (70% or more) signal downtrend confirmation
• Reversal Detection Strategy:
▶ Decreasing sell ratio during a downtrend suggests potential rebound
▶ Decreasing buy ratio during an uptrend suggests potential correction
• Volatility Breakout Strategy:
▶ Rapid changes in buy/sell ratio from a balanced state (50%) provide breakout signals
▶ Dramatic shifts in the opposite direction after extreme ratios signal trend reversals
─────────────────────────────────────
◆ Advanced Setting Options
■ Gauge Settings
• Gauge Width: Default value 15 (can be adjusted narrower or wider)
• Position Adjustment: Can be positioned at various locations on the chart (default is middle right)
• Border Thickness: Adjust border thickness for gauge visibility (default is 4)
■ Color Customization
• Buy Gradient: Color range can be modified according to personal preference
• Sell Gradient: Color range can be modified according to personal preference
• Transparency Settings: Optimize chart readability by adjusting background color transparency
■ Display Frequency Settings
• Update Cycle: Can be set to update every bar or at specific intervals
• History Length: Set display range for historical data
─────────────────────────────────────
◆ Synergy with Other Indicators
• Volume Profile: Analyze the Bid/Ask Intensity Monitor together with volume distribution to confirm buying/selling pressure at key price levels
• RSI: Improve signal reliability by checking extreme values of the Bid/Ask Intensity Monitor alongside RSI's overbought/oversold levels
• Moving Averages: Observe changes in the Bid/Ask Intensity Monitor when price is near key moving averages to assess support/resistance strength
• Bollinger Bands: Observe the Bid/Ask Intensity Monitor's reaction at band boundaries to evaluate potential reversals or trend continuation
─────────────────────────────────────
◆ Conclusion
52SIGNAL RECIPE Bid/Ask Intensity Monitor is a powerful tool that visualizes market participants' psychology and behavior in real-time based on candle structure. Through intuitive color gradients and percentage displays, it allows for immediate understanding of the balance between buying and selling forces, greatly aiding in predicting short-term market direction and momentum. When used in conjunction with other technical indicators, it provides a comprehensive understanding of market conditions, contributing to more accurate entry and exit timing decisions. This indicator, particularly useful in scalping and short-term trading, will enhance the chart analysis capabilities of all traders.
─────────────────────────────────────
※ Disclaimer: Past performance does not guarantee future results. Always use appropriate risk management strategies.
═══ 52SIGNAL RECIPE Bid/Ask Intensity Monitor ═══
◆ 개요
52SIGNAL RECIPE Bid/Ask Intensity Monitor는 실시간으로 시장의 매수/매도 세력 균형을 시각화하는 기술적 지표입니다. 이 지표는 캔들 구조를 기반으로 매수와 매도 압력의 상대적 강도를 계산하고, 직관적인 그라데이션 색상 게이지를 통해 표시함으로써 시장 참여자들의 단기 심리와 거래 활동을 한눈에 파악할 수 있게 합니다.
─────────────────────────────────────
◆ 주요 특징
• 직관적인 시각화: 매수/매도 비율을 색상 그라데이션 게이지로 즉각적으로 인식
• 실시간 세력 균형: 현재 봉에서의 매수/매도 세력 비율을 백분율로 정확히 표시
• 캔들 구조 기반 분석: 고가, 저가, 종가의 관계를 통해 시장 참여자 행동 해석
• 차트 오버레이: 차트 위에 표시되어 가격 움직임과 함께 세력 균형 변화 관찰 가능
• 색상 심리학 활용: 파란색 계열(매수)과 붉은색 계열(매도)로 직관적인 심리적 이해 제공
─────────────────────────────────────
◆ 기술적 기반
■ 매수/매도 비율 계산
• 기본 원리: 캔들의 구조를 분석하여 매수자와 매도자의 상대적 강도 측정
• 매수 비율 계산: (종가 - 저가) ÷ (고가 - 저가)
• 매도 비율 계산: 1 - 매수 비율
• 해석 논리: 종가가 고가에 가까울수록 매수 세력이 강하고, 저가에 가까울수록 매도 세력이 강함
■ 시각화 메커니즘
• 그라데이션 컬러 맵: 12단계 색상 그라데이션으로 매수/매도 강도 표현
• 매수 색상 범위: 밝은 하늘색(#8be2ff)에서 짙은 남색(#103c60)까지 점진적 변화
• 매도 색상 범위: 밝은 분홍색(#f65575)에서 짙은 적갈색(#3d101a)까지 점진적 변화
• 게이지 구조: 세로형 테이블로 우측 중앙에 배치되어 시각적 주목도 향상
─────────────────────────────────────
◆ 실용적 응용
■ 시장 심리 파악
• 강한 매수 압력 신호:
▶ 매수 비율이 70% 이상으로 표시될 때
▶ 게이지가 밝은 청색 계열로 채워질 때
• 강한 매도 압력 신호:
▶ 매도 비율이 70% 이상으로 표시될 때
▶ 게이지가 밝은 적색 계열로 채워질 때
• 세력 균형 상태:
▶ 매수/매도 비율이 40-60% 범위에 있을 때
▶ 게이지의 색상 분포가 균등할 때
■ 트레이딩 전략 적용
• 추세 확인 전략:
▶ 연속적인 높은 매수 비율(70% 이상)은 상승 추세 확인 신호
▶ 연속적인 높은 매도 비율(70% 이상)은 하락 추세 확인 신호
• 반전 탐색 전략:
▶ 하락 추세 중 매도 비율 감소는 반등 가능성 시사
▶ 상승 추세 중 매수 비율 감소는 조정 가능성 시사
• 변동성 돌파 전략:
▶ 균형 상태(50%)에서 급격한 매수/매도 비율 변화는 돌파 신호 제공
▶ 극단적 비율 후 반대 방향으로의 급격한 변화는 추세 전환 신호
─────────────────────────────────────
◆ 고급 설정 옵션
■ 게이지 설정
• 게이지 너비: 기본값 15 (좁게 또는 넓게 조정 가능)
• 위치 조정: 차트의 다양한 위치에 배치 가능 (우측 중앙 기본값)
• 테두리 두께: 게이지 가시성을 위한 테두리 굵기 조절 (기본값 4)
■ 색상 커스터마이징
• 매수 그라데이션: 개인 선호에 따라 색상 범위 수정 가능
• 매도 그라데이션: 개인 선호에 따라 색상 범위 수정 가능
• 투명도 설정: 배경색 투명도 조절로 차트 가독성 최적화
■ 표시 빈도 설정
• 업데이트 주기: 모든 봉마다 또는 특정 간격으로 업데이트 설정 가능
• 히스토리 길이: 과거 데이터에 대한 표시 범위 설정
─────────────────────────────────────
◆ 다른 지표와의 시너지
• 볼륨 프로파일: Bid/Ask Intensity Monitor와 볼륨 분포를 함께 분석하여 주요 가격대의 매수/매도 압력 확인
• RSI: Bid/Ask Intensity Monitor의 극단치와 RSI의 과매수/과매도 수준을 함께 확인하여 신호 신뢰도 향상
• 이동평균선: 가격이 주요 이동평균선 근처에서 Bid/Ask Intensity Monitor 변화를 관찰하여 지지/저항 강도 판단
• 볼린저 밴드: 밴드 경계에서의 Bid/Ask Intensity Monitor 반응을 관찰하여 반전 또는 추세 지속 가능성 평가
─────────────────────────────────────
◆ 결론
52SIGNAL RECIPE Bid/Ask Intensity Monitor는 캔들 구조를 기반으로 시장 참여자들의 심리와 행동을 실시간으로 시각화하는 강력한 도구입니다. 직관적인 색상 그라데이션과 백분율 표시를 통해 매수/매도 세력의 균형을 즉각적으로 파악할 수 있어, 시장의 단기적 방향성과 모멘텀을 예측하는 데 큰 도움이 됩니다. 다른 기술적 지표와 함께 사용하면 시장 상황에 대한 종합적인 이해를 얻을 수 있으며, 이는 더 정확한 진입 및 퇴출 타이밍을 결정하는 데 기여합니다. 특히 스캘핑과 단기 트레이딩에서 유용하게 활용될 수 있는 이 지표는 모든 트레이더의 차트 분석 능력을 한 단계 향상시켜 줄 것입니다.
─────────────────────────────────────
※ 면책 조항: 과거 성과가 미래 결과를 보장하지 않습니다. 항상 적절한 리스크 관리 전략을 사용하세요.
◆ Overview
52SIGNAL RECIPE Bid/Ask Intensity Monitor is a technical indicator that visualizes the balance of buying and selling forces in the market in real-time. Based on candle structure, this indicator calculates the relative strength of buying and selling pressure, displaying it through an intuitive color gradient gauge that allows traders to instantly grasp short-term market psychology and trading activity.
─────────────────────────────────────
◆ Key Features
• Intuitive Visualization: Instantly recognize buy/sell ratios through color gradient gauges
• Real-time Force Balance: Accurately display the buy/sell force ratio as a percentage in the current candle
• Candle Structure Analysis: Interpret market participant behavior through relationships between high, low, and close prices
• Chart Overlay: Displayed on the chart to observe changes in force balance alongside price movements
• Color Psychology: Provides intuitive psychological understanding through blue series (buy) and red series (sell) colors
─────────────────────────────────────
◆ Technical Foundation
■ Buy/Sell Ratio Calculation
• Basic Principle: Measure the relative strength of buyers and sellers by analyzing candle structure
• Buy Ratio Calculation: (Close - Low) ÷ (High - Low)
• Sell Ratio Calculation: 1 - Buy Ratio
• Interpretation Logic: The closer the closing price is to the high, the stronger the buying force; the closer to the low, the stronger the selling force
■ Visualization Mechanism
• Gradient Color Map: Express buy/sell intensity through 12-level color gradients
• Buy Color Range: Gradual change from light sky blue (#8be2ff) to deep navy blue (#103c60)
• Sell Color Range: Gradual change from light pink (#f65575) to deep burgundy (#3d101a)
• Gauge Structure: Vertical table positioned in the middle right of the chart for enhanced visual focus
─────────────────────────────────────
◆ Practical Applications
■ Market Psychology Identification
• Strong Buying Pressure Signals:
▶ When buy ratio is displayed as 70% or higher
▶ When the gauge is filled with bright blue shades
• Strong Selling Pressure Signals:
▶ When sell ratio is displayed as 70% or higher
▶ When the gauge is filled with bright red shades
• Force Balance State:
▶ When buy/sell ratio is in the 40-60% range
▶ When the color distribution in the gauge is even
■ Trading Strategy Application
• Trend Confirmation Strategy:
▶ Consecutive high buy ratios (70% or more) signal uptrend confirmation
▶ Consecutive high sell ratios (70% or more) signal downtrend confirmation
• Reversal Detection Strategy:
▶ Decreasing sell ratio during a downtrend suggests potential rebound
▶ Decreasing buy ratio during an uptrend suggests potential correction
• Volatility Breakout Strategy:
▶ Rapid changes in buy/sell ratio from a balanced state (50%) provide breakout signals
▶ Dramatic shifts in the opposite direction after extreme ratios signal trend reversals
─────────────────────────────────────
◆ Advanced Setting Options
■ Gauge Settings
• Gauge Width: Default value 15 (can be adjusted narrower or wider)
• Position Adjustment: Can be positioned at various locations on the chart (default is middle right)
• Border Thickness: Adjust border thickness for gauge visibility (default is 4)
■ Color Customization
• Buy Gradient: Color range can be modified according to personal preference
• Sell Gradient: Color range can be modified according to personal preference
• Transparency Settings: Optimize chart readability by adjusting background color transparency
■ Display Frequency Settings
• Update Cycle: Can be set to update every bar or at specific intervals
• History Length: Set display range for historical data
─────────────────────────────────────
◆ Synergy with Other Indicators
• Volume Profile: Analyze the Bid/Ask Intensity Monitor together with volume distribution to confirm buying/selling pressure at key price levels
• RSI: Improve signal reliability by checking extreme values of the Bid/Ask Intensity Monitor alongside RSI's overbought/oversold levels
• Moving Averages: Observe changes in the Bid/Ask Intensity Monitor when price is near key moving averages to assess support/resistance strength
• Bollinger Bands: Observe the Bid/Ask Intensity Monitor's reaction at band boundaries to evaluate potential reversals or trend continuation
─────────────────────────────────────
◆ Conclusion
52SIGNAL RECIPE Bid/Ask Intensity Monitor is a powerful tool that visualizes market participants' psychology and behavior in real-time based on candle structure. Through intuitive color gradients and percentage displays, it allows for immediate understanding of the balance between buying and selling forces, greatly aiding in predicting short-term market direction and momentum. When used in conjunction with other technical indicators, it provides a comprehensive understanding of market conditions, contributing to more accurate entry and exit timing decisions. This indicator, particularly useful in scalping and short-term trading, will enhance the chart analysis capabilities of all traders.
─────────────────────────────────────
※ Disclaimer: Past performance does not guarantee future results. Always use appropriate risk management strategies.
═══ 52SIGNAL RECIPE Bid/Ask Intensity Monitor ═══
◆ 개요
52SIGNAL RECIPE Bid/Ask Intensity Monitor는 실시간으로 시장의 매수/매도 세력 균형을 시각화하는 기술적 지표입니다. 이 지표는 캔들 구조를 기반으로 매수와 매도 압력의 상대적 강도를 계산하고, 직관적인 그라데이션 색상 게이지를 통해 표시함으로써 시장 참여자들의 단기 심리와 거래 활동을 한눈에 파악할 수 있게 합니다.
─────────────────────────────────────
◆ 주요 특징
• 직관적인 시각화: 매수/매도 비율을 색상 그라데이션 게이지로 즉각적으로 인식
• 실시간 세력 균형: 현재 봉에서의 매수/매도 세력 비율을 백분율로 정확히 표시
• 캔들 구조 기반 분석: 고가, 저가, 종가의 관계를 통해 시장 참여자 행동 해석
• 차트 오버레이: 차트 위에 표시되어 가격 움직임과 함께 세력 균형 변화 관찰 가능
• 색상 심리학 활용: 파란색 계열(매수)과 붉은색 계열(매도)로 직관적인 심리적 이해 제공
─────────────────────────────────────
◆ 기술적 기반
■ 매수/매도 비율 계산
• 기본 원리: 캔들의 구조를 분석하여 매수자와 매도자의 상대적 강도 측정
• 매수 비율 계산: (종가 - 저가) ÷ (고가 - 저가)
• 매도 비율 계산: 1 - 매수 비율
• 해석 논리: 종가가 고가에 가까울수록 매수 세력이 강하고, 저가에 가까울수록 매도 세력이 강함
■ 시각화 메커니즘
• 그라데이션 컬러 맵: 12단계 색상 그라데이션으로 매수/매도 강도 표현
• 매수 색상 범위: 밝은 하늘색(#8be2ff)에서 짙은 남색(#103c60)까지 점진적 변화
• 매도 색상 범위: 밝은 분홍색(#f65575)에서 짙은 적갈색(#3d101a)까지 점진적 변화
• 게이지 구조: 세로형 테이블로 우측 중앙에 배치되어 시각적 주목도 향상
─────────────────────────────────────
◆ 실용적 응용
■ 시장 심리 파악
• 강한 매수 압력 신호:
▶ 매수 비율이 70% 이상으로 표시될 때
▶ 게이지가 밝은 청색 계열로 채워질 때
• 강한 매도 압력 신호:
▶ 매도 비율이 70% 이상으로 표시될 때
▶ 게이지가 밝은 적색 계열로 채워질 때
• 세력 균형 상태:
▶ 매수/매도 비율이 40-60% 범위에 있을 때
▶ 게이지의 색상 분포가 균등할 때
■ 트레이딩 전략 적용
• 추세 확인 전략:
▶ 연속적인 높은 매수 비율(70% 이상)은 상승 추세 확인 신호
▶ 연속적인 높은 매도 비율(70% 이상)은 하락 추세 확인 신호
• 반전 탐색 전략:
▶ 하락 추세 중 매도 비율 감소는 반등 가능성 시사
▶ 상승 추세 중 매수 비율 감소는 조정 가능성 시사
• 변동성 돌파 전략:
▶ 균형 상태(50%)에서 급격한 매수/매도 비율 변화는 돌파 신호 제공
▶ 극단적 비율 후 반대 방향으로의 급격한 변화는 추세 전환 신호
─────────────────────────────────────
◆ 고급 설정 옵션
■ 게이지 설정
• 게이지 너비: 기본값 15 (좁게 또는 넓게 조정 가능)
• 위치 조정: 차트의 다양한 위치에 배치 가능 (우측 중앙 기본값)
• 테두리 두께: 게이지 가시성을 위한 테두리 굵기 조절 (기본값 4)
■ 색상 커스터마이징
• 매수 그라데이션: 개인 선호에 따라 색상 범위 수정 가능
• 매도 그라데이션: 개인 선호에 따라 색상 범위 수정 가능
• 투명도 설정: 배경색 투명도 조절로 차트 가독성 최적화
■ 표시 빈도 설정
• 업데이트 주기: 모든 봉마다 또는 특정 간격으로 업데이트 설정 가능
• 히스토리 길이: 과거 데이터에 대한 표시 범위 설정
─────────────────────────────────────
◆ 다른 지표와의 시너지
• 볼륨 프로파일: Bid/Ask Intensity Monitor와 볼륨 분포를 함께 분석하여 주요 가격대의 매수/매도 압력 확인
• RSI: Bid/Ask Intensity Monitor의 극단치와 RSI의 과매수/과매도 수준을 함께 확인하여 신호 신뢰도 향상
• 이동평균선: 가격이 주요 이동평균선 근처에서 Bid/Ask Intensity Monitor 변화를 관찰하여 지지/저항 강도 판단
• 볼린저 밴드: 밴드 경계에서의 Bid/Ask Intensity Monitor 반응을 관찰하여 반전 또는 추세 지속 가능성 평가
─────────────────────────────────────
◆ 결론
52SIGNAL RECIPE Bid/Ask Intensity Monitor는 캔들 구조를 기반으로 시장 참여자들의 심리와 행동을 실시간으로 시각화하는 강력한 도구입니다. 직관적인 색상 그라데이션과 백분율 표시를 통해 매수/매도 세력의 균형을 즉각적으로 파악할 수 있어, 시장의 단기적 방향성과 모멘텀을 예측하는 데 큰 도움이 됩니다. 다른 기술적 지표와 함께 사용하면 시장 상황에 대한 종합적인 이해를 얻을 수 있으며, 이는 더 정확한 진입 및 퇴출 타이밍을 결정하는 데 기여합니다. 특히 스캘핑과 단기 트레이딩에서 유용하게 활용될 수 있는 이 지표는 모든 트레이더의 차트 분석 능력을 한 단계 향상시켜 줄 것입니다.
─────────────────────────────────────
※ 면책 조항: 과거 성과가 미래 결과를 보장하지 않습니다. 항상 적절한 리스크 관리 전략을 사용하세요.
Nota Keluaran
Feature update completeSkrip dilindungi
Skrip ini diterbitkan sebagai sumber tertutup. Akan tetapi, anda boleh menggunakannya secara bebas dan tanpa apa-apa had – ketahui lebih di sini.
Recipe your trading with 52SIGNAL.
No more repainting tricks, fake backtesting data, or unrealistic returns.
No more repainting tricks, fake backtesting data, or unrealistic returns.
Penafian
Maklumat dan penerbitan adalah tidak bertujuan, dan tidak membentuk, nasihat atau cadangan kewangan, pelaburan, dagangan atau jenis lain yang diberikan atau disahkan oleh TradingView. Baca lebih dalam Terma Penggunaan.
Skrip dilindungi
Skrip ini diterbitkan sebagai sumber tertutup. Akan tetapi, anda boleh menggunakannya secara bebas dan tanpa apa-apa had – ketahui lebih di sini.
Recipe your trading with 52SIGNAL.
No more repainting tricks, fake backtesting data, or unrealistic returns.
No more repainting tricks, fake backtesting data, or unrealistic returns.
Penafian
Maklumat dan penerbitan adalah tidak bertujuan, dan tidak membentuk, nasihat atau cadangan kewangan, pelaburan, dagangan atau jenis lain yang diberikan atau disahkan oleh TradingView. Baca lebih dalam Terma Penggunaan.