PROTECTED SOURCE SCRIPT
Market Sentiment Indicator with Adjustable Metric Smoothing
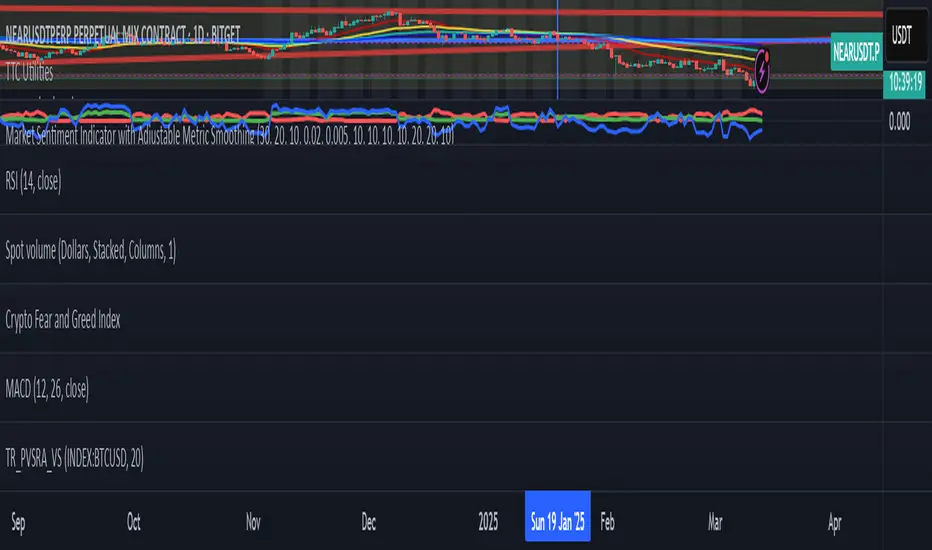
Market Sentiment Indicator for BTCUSDT: How It Works
This indicator analyzes market sentiment for BTCUSDT by combining data from various financial metrics like the VIX, DXY, SPX, GOLD, USOIL, US10Y, and BTC itself. It processes this data to assign scores that reflect bearish, bullish, or neutral conditions, ultimately providing a sentiment value. Here’s the step-by-step process:
1. Input Parameters
VIX Thresholds: Define levels (e.g., high, moderate, low) to identify risk-off (bearish) or risk-on (bullish) market conditions.
Change Thresholds: Set limits for "large" and "small" percentage changes in metrics like DXY (Dollar Index), SPX (S&P 500), and BTC, as well as other assets.
2. Data Fetching
Collect closing prices for:
VIX (volatility index)
DXY (U.S. Dollar Index)
SPX (S&P 500)
GOLD (gold price)
USOIL (crude oil price)
US10Y (10-year Treasury yield)
BTC (from the BTCUSDT chart)
These are typically retrieved using a function like request.security in a trading platform.
3. Smoothed Data
Apply Exponential Moving Averages (EMAs) to the closing prices of each metric to smooth out noise. The smoothing length (e.g., 10-day, 20-day) is customizable.
Calculate:
Smoothed percentage changes for DXY, SPX, BTC, GOLD, and USOIL.
Absolute change for US10Y (since it’s a yield, not a price).
4. Step Scores Calculation
The indicator assigns scores based on specific market conditions:
Step 1: Strong Risk-Off (Bearish)
High VIX, strongly rising DXY, strongly falling SPX and BTC.
Step 2: Moderate Risk-Off (Bearish)
Moderately high VIX, moderately rising DXY, moderately falling SPX and BTC.
Step 3: Neutral
VIX near neutral, small changes in DXY, SPX, and BTC.
Step 4: Moderate Risk-On (Bullish)
Moderately low VIX, moderately falling DXY, moderately rising SPX and BTC.
Step 5: Strong Risk-On (Bullish)
Low VIX, strongly falling DXY, strongly rising SPX and BTC.
Step 6: Inflation Concern
Rising GOLD, USOIL, US10Y, and falling DXY.
Step 7: Deflation Concern
Falling GOLD, USOIL, US10Y, and rising DXY.
5. Composite Scores
Bearish Composite: Sum of Step 1 (strong risk-off) and Step 2 (moderate risk-off) scores.
Bullish Composite: Sum of Step 4 (moderate risk-on) and Step 5 (strong risk-on) scores.
6. Sentiment Calculation
Compute a weighted average of all step scores:
Weights: -3 (Step 1), -2 (Step 2), 0 (Step 3), 2 (Step 4), 3 (Step 5), 1 (Step 6), -1 (Step 7).
This produces a sentiment score ranging from negative (bearish) to positive (bullish).
If the total score is zero, sentiment is set to zero to avoid issues.
7. Visualization
Bearish Composite: Plotted in red.
Bullish Composite: Plotted in green.
Sentiment: Plotted in blue.
Why It’s Useful
This indicator gives you a comprehensive view of market sentiment by blending traditional financial metrics (like VIX and SPX) with BTC-specific data. The use of EMAs and customizable thresholds makes it adaptable to different timeframes and market conditions, helping you gauge whether the market is leaning bearish, bullish, or neutral.
Skrip dilindungi
Skrip ini diterbitkan sebagai sumber tertutup. Akan tetapi, anda boleh menggunakannya secara bebas dan tanpa apa-apa had – ketahui lebih di sini.
Penafian
Maklumat dan penerbitan adalah tidak bertujuan, dan tidak membentuk, nasihat atau cadangan kewangan, pelaburan, dagangan atau jenis lain yang diberikan atau disahkan oleh TradingView. Baca lebih dalam Terma Penggunaan.