OPEN-SOURCE SCRIPT
Klinger Safety Zones
This indicator is based on the Klinger Volume Oscillator, or KVO. The KVO is pretty cool since it can track long-term changes in money flow (both into and out of a market), as well as respond and predict short term price fluctuations.
The Klinger Oscillator determines the direction (or trend) of money flow based on the high, low, and closing price of the security. It then compares all three values (HLC/3) to the previous period’s values to determine how volume should be factored into the KVO. If the current period’s price is greater than that of the previous period, then volume is added. It is subtracted, however, if the price is less than the previous period. This utilization of volume is what makes it an accurate tracker of money flow and a valuable confirmation indicator. This value is often called volume force or the “trend” line.
A fast and slow EMA of the volume force are then calculated. The fast EMA has a smaller window length, while the slow EMA has a larger window. Traders can adjust the lengths of each EMA in the input option menu, but we chose the standard 55 and 34 period lengths as the default settings. We are finally left with the actual KVO value after subtracting the slow EMA from the fast EMA.
The Klinger Oscillator uses a signal line similar to the MACD and many other indicators. The default length for it is 13, but that length can also be adjusted in the input menu. A shorter length will result in more responsiveness but possibly more false signals and whipsaws.
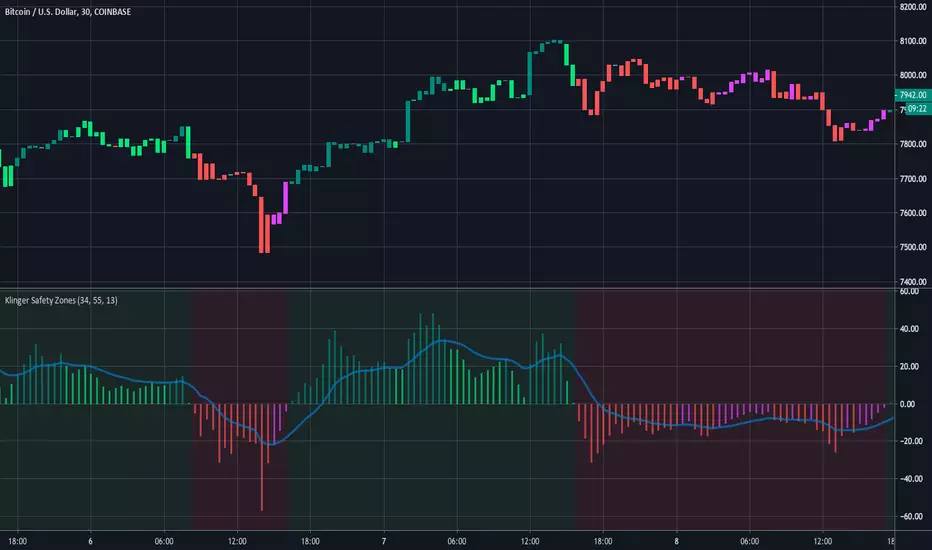
The Chart and Interpretation:
The histogram shows the KVO series. Remember, since the Oscillator represents the difference between the fast and slow EMA, the KVO is bullish when it is greater than zero and bearish when it is less than zero.
When the KVO is greater than zero, the background on the chart is green, meaning that the trend is bullish and traders should look to go long. On the flip side, the background is red when the KVO is less than zero meaning traders should look to go short.
The aqua line plotted on top of the histogram is the signal line.
Here is a quick summary of the histogram colors:
(if KVO > 0 and KVO > signal)
then (color = teal)
if (KVO > 0 and KVO < signal)
then (color = lime)
if (KVO < 0 and KVO < signal)
then (color = red)
if (KVO < 0 and KVO > signal)
then (color = pink)
Users can choose to have the candles change color to match the KVO histogram color by adjusting the setting in the input menu.
~Happy (and safe) trading~
The Klinger Oscillator determines the direction (or trend) of money flow based on the high, low, and closing price of the security. It then compares all three values (HLC/3) to the previous period’s values to determine how volume should be factored into the KVO. If the current period’s price is greater than that of the previous period, then volume is added. It is subtracted, however, if the price is less than the previous period. This utilization of volume is what makes it an accurate tracker of money flow and a valuable confirmation indicator. This value is often called volume force or the “trend” line.
A fast and slow EMA of the volume force are then calculated. The fast EMA has a smaller window length, while the slow EMA has a larger window. Traders can adjust the lengths of each EMA in the input option menu, but we chose the standard 55 and 34 period lengths as the default settings. We are finally left with the actual KVO value after subtracting the slow EMA from the fast EMA.
The Klinger Oscillator uses a signal line similar to the MACD and many other indicators. The default length for it is 13, but that length can also be adjusted in the input menu. A shorter length will result in more responsiveness but possibly more false signals and whipsaws.
The Chart and Interpretation:
The histogram shows the KVO series. Remember, since the Oscillator represents the difference between the fast and slow EMA, the KVO is bullish when it is greater than zero and bearish when it is less than zero.
When the KVO is greater than zero, the background on the chart is green, meaning that the trend is bullish and traders should look to go long. On the flip side, the background is red when the KVO is less than zero meaning traders should look to go short.
The aqua line plotted on top of the histogram is the signal line.
Here is a quick summary of the histogram colors:
(if KVO > 0 and KVO > signal)
then (color = teal)
if (KVO > 0 and KVO < signal)
then (color = lime)
if (KVO < 0 and KVO < signal)
then (color = red)
if (KVO < 0 and KVO > signal)
then (color = pink)
Users can choose to have the candles change color to match the KVO histogram color by adjusting the setting in the input menu.
~Happy (and safe) trading~
Skrip sumber terbuka
Dalam semangat TradingView sebenar, pencipta skrip ini telah menjadikannya sumber terbuka, jadi pedagang boleh menilai dan mengesahkan kefungsiannya. Terima kasih kepada penulis! Walaupuan anda boleh menggunakan secara percuma, ingat bahawa penerbitan semula kod ini tertakluk kepada Peraturan Dalaman.
-Profit Programmers
profitprogrammer.com
profitprogrammer.com
Penafian
Maklumat dan penerbitan adalah tidak bertujuan, dan tidak membentuk, nasihat atau cadangan kewangan, pelaburan, dagangan atau jenis lain yang diberikan atau disahkan oleh TradingView. Baca lebih dalam Terma Penggunaan.