OPEN-SOURCE SCRIPT
Stock Highs Tracker
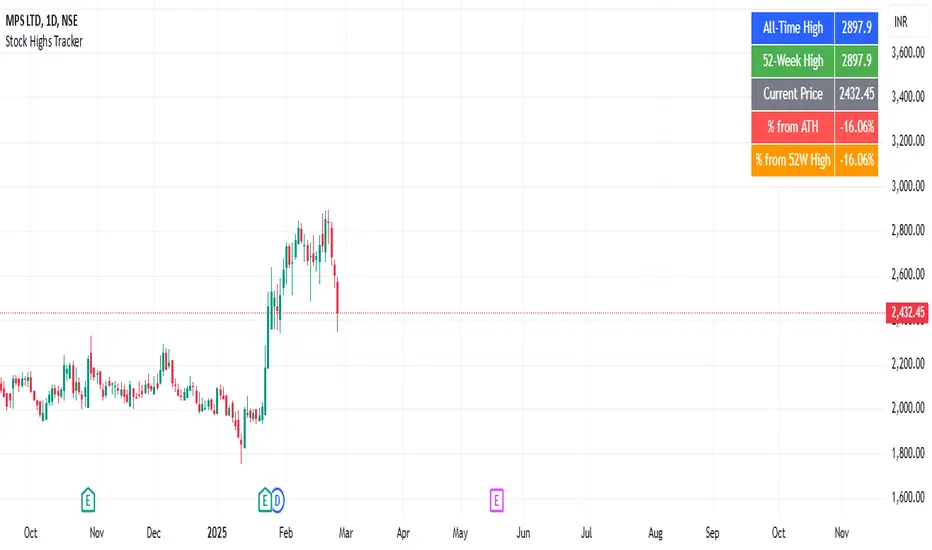
This indicator tracks key stock price levels including the all-time high (ATH), 52-week high, and current price.
It calculates the percentage difference of the current price from both the ATH and 52-week high.
The data is displayed in a table at the top-right corner of the chart, allowing traders to quickly assess the stock’s performance relative to its historical highs.
This is useful for identifying stocks trading near their highs or experiencing significant pullbacks.
Skrip sumber terbuka
Dalam semangat TradingView sebenar, pencipta skrip ini telah menjadikannya sumber terbuka, jadi pedagang boleh menilai dan mengesahkan kefungsiannya. Terima kasih kepada penulis! Walaupuan anda boleh menggunakan secara percuma, ingat bahawa penerbitan semula kod ini tertakluk kepada Peraturan Dalaman.
Penafian
Maklumat dan penerbitan adalah tidak bertujuan, dan tidak membentuk, nasihat atau cadangan kewangan, pelaburan, dagangan atau jenis lain yang diberikan atau disahkan oleh TradingView. Baca lebih dalam Terma Penggunaan.