OPEN-SOURCE SCRIPT
Telah dikemas kini Half Supertrend [NLR]
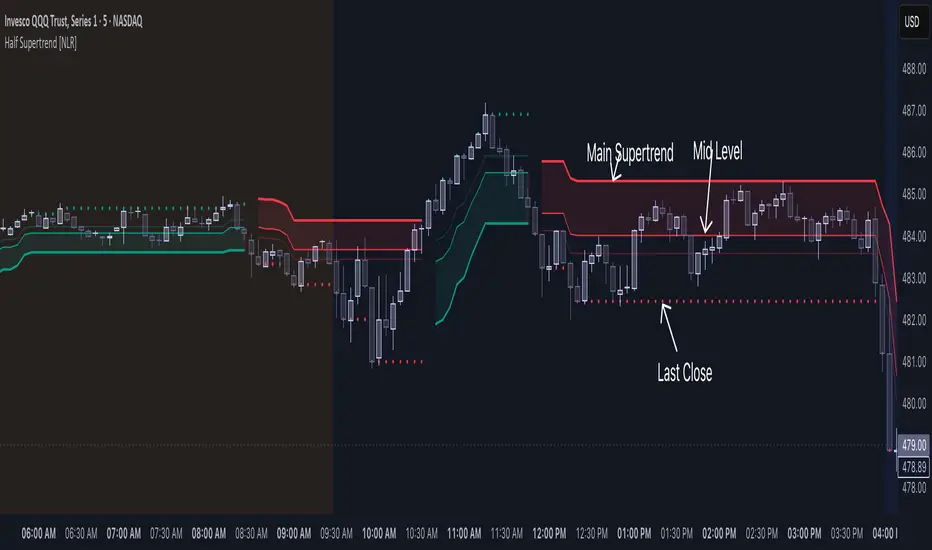
While the Supertrend is a popular tool, traders often face the challenge of false signals and uncertain entry points. The Half Supertrend [NLR] indicator addresses these shortcomings by introducing a dynamic mid-level, offering a significantly improved way to identify true trend strength and potential high-probability entries.
Here's how the mid-level enhances your trend analysis:
Here's the technical edge you've been waiting for:
How it works under the hood:
This indicator utilizes the standard Supertrend calculation on the chosen higher timeframe, incorporating the Average True Range (ATR) to determine volatility-adjusted bands. The unique addition is the "half trend" line, calculated by adding or subtracting half of the ATR-based trailing stop value from the Supertrend line. This mid-level acts as a crucial intermediary zone for evaluating the conviction of the current trend.
Pine Script®
Key Input Parameters:
Here's how the mid-level enhances your trend analysis:
- Filter Out Noise: Instead of reacting to every Supertrend flip, the mid-level helps you identify the strength of the trend. Price moving strongly away from the mid-level confirms a higher conviction move.
- Identify Optimal Pullback Entries: Waiting for price to pull back to the dynamic mid-level after a Supertrend direction change can provide better entry prices and potentially higher probability setups, capitalizing on established momentum. This approach helps avoid entering prematurely on weaker signals.
- Gain Deeper Trend Insight: The position of the price relative to both the Supertrend line and the mid-level paints a clearer picture of the current trend's strength and potential for continuation or reversal.
Here's the technical edge you've been waiting for:
- Enhanced Trend Confirmation: This indicator plots a mid-level derived from half the Average True Range (ATR) multiple, acting as a crucial intermediary for assessing trend strength.
- Intra-Trend Strength Analysis:
Price above/below the mid-level: Indicates a strong trending move aligned with the Supertrend direction.
Price between the mid-level and the Supertrend line: Suggests a weaker trend and a higher probability of consolidation or reversal. - Early Reversal Detection: Price crossing the mid-level can serve as an early warning signal of a potential trend change.
- Higher Timeframe Clarity: The user-configurable higher timeframe (HTF) input provides a robust, multi-timeframe trend bias.
- Dynamic Entry Levels: Potential entry levels based on the mid-level are plotted for visual guidance.
- Clear Visual Representation: Color-coded lines and filled areas simplify trend and strength assessment.
How it works under the hood:
This indicator utilizes the standard Supertrend calculation on the chosen higher timeframe, incorporating the Average True Range (ATR) to determine volatility-adjusted bands. The unique addition is the "half trend" line, calculated by adding or subtracting half of the ATR-based trailing stop value from the Supertrend line. This mid-level acts as a crucial intermediary zone for evaluating the conviction of the current trend.
// Calculate the mid-level line
half_line = supertrend + (atr * half_factor)
Key Input Parameters:
- ATR Length: Determines the period for calculating the Average True Range (default: 10).
- Factor: The multiplier applied to the ATR to determine the Supertrend band width (default: 3). The mid-level dynamically adjusts based on half of this factor.
- Timeframe: Allows you to select a higher timeframe for the Supertrend calculation, providing a broader trend context.
- Up Color/Down Color: Customize the colors for uptrend and downtrend indications.
Nota Keluaran
Removed default extra timeframe featureSkrip sumber terbuka
Dalam semangat TradingView sebenar, pencipta skrip ini telah menjadikannya sumber terbuka, jadi pedagang boleh menilai dan mengesahkan kefungsiannya. Terima kasih kepada penulis! Walaupuan anda boleh menggunakan secara percuma, ingat bahawa penerbitan semula kod ini tertakluk kepada Peraturan Dalaman.
Penafian
Maklumat dan penerbitan adalah tidak bertujuan, dan tidak membentuk, nasihat atau cadangan kewangan, pelaburan, dagangan atau jenis lain yang diberikan atau disahkan oleh TradingView. Baca lebih dalam Terma Penggunaan.
Skrip sumber terbuka
Dalam semangat TradingView sebenar, pencipta skrip ini telah menjadikannya sumber terbuka, jadi pedagang boleh menilai dan mengesahkan kefungsiannya. Terima kasih kepada penulis! Walaupuan anda boleh menggunakan secara percuma, ingat bahawa penerbitan semula kod ini tertakluk kepada Peraturan Dalaman.
Penafian
Maklumat dan penerbitan adalah tidak bertujuan, dan tidak membentuk, nasihat atau cadangan kewangan, pelaburan, dagangan atau jenis lain yang diberikan atau disahkan oleh TradingView. Baca lebih dalam Terma Penggunaan.