OPEN-SOURCE SCRIPT
Telah dikemas kini Power X Strategy Back-test
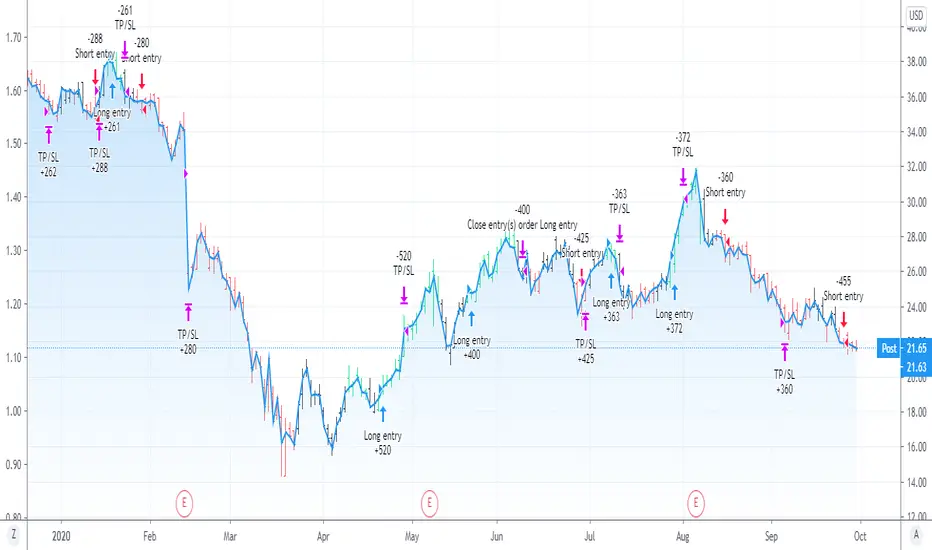
This script back-test the Power X Strategy developed by Markus Heitkoetter and Rockwell Trading. For more detail about the strategy, please refer to "The PowerX Strategy: How to Trade Stocks and Options in Only 15 Minutes a Day" written by Markus Heitkoetter. Note that this script is not publish, develop or maintain by Rockwell Trading, and may have different results. Rockwell Trading has a powerful software called Power X Optimizer, which scan, back-test and optimize the best stock for the strategy.
The Power X Strategy uses RSI , Slow Stochastic and MACD indicators under the hood. When RSI and slow Stochastic are both greater than 50 and MACD crosses up the signal line, it marks as up-trend. If RSI and slow stochastic are both less than 50 and MACD crosses down the signal line, it marks as down-trend. Other are mark as no trend.
This back-test makes a long entry with an up-trend momentum and short entry with down-trend momentum. Trade is exited when profit target or stop lose is reach. Profit target and stop lose is calculated based on 7 days Average Daily Range (ADR).
If the either of the momentum is lost, trade is exited the next day. It also skips the entire month of March 2020, since the market crash and is not in a normal market condition for the strategy.
Nota Keluaran
This script back-test the Power X Strategy developed by Markus Heitkoetter and Rockwell Trading. For more detail about the strategy, please refer to "The PowerX Strategy: How to Trade Stocks and Options in Only 15 Minutes a Day" written by Markus Heitkoetter. Note that this script is not publish, develop or maintain by Rockwell Trading, and may have different results. Rockwell Trading has a powerful software called Power X Optimizer, which scan, back-test and optimize the best stock for the strategy.The Power X Strategy uses RSI , Slow Stochastic and MACD indicators under the hood. When RSI and slow Stochastic are both greater than 50 and MACD crosses up the signal line, it marks as up-trend. If RSI and slow stochastic are both less than 50 and MACD crosses down the signal line, it marks as down-trend. Other are mark as no trend.
This back-test makes a long entry with an up-trend momentum and short entry with down-trend momentum. Trade is exited when profit target or stop lose is reach. Profit target and stop lose is calculated based on 7 days Average Daily Range (ADR).
If the either of the momentum is lost, trade is exited the next day. It also skips the entire month of March 2020, since the market crash and is not in a normal market condition for the strategy.
V2
- Removed the option for only testing long or short. Since it was not working at the first place
- Added an input check box as an option skip the month of March due to the Covid-19 crash. Default is to skip it.
- Added an input option to adjust the amount of the account to risk. The default is 100%.
Nota Keluaran
- Udpate the covid-19 crash period. Skipping Feb 20 2020 to Mar 26 2020.Nota Keluaran
- Add option to not enter a trade if the stock gapped more than certain %. Enable by a checkbox.- The default of maximum gap is 2%
Nota Keluaran
- Adjust average daily range to be the average range of past 7 interval period which allows for testing the strategy on different interval.Nota Keluaran
- update default start dateSkrip sumber terbuka
Dalam semangat TradingView sebenar, pencipta skrip ini telah menjadikannya sumber terbuka, jadi pedagang boleh menilai dan mengesahkan kefungsiannya. Terima kasih kepada penulis! Walaupuan anda boleh menggunakan secara percuma, ingat bahawa penerbitan semula kod ini tertakluk kepada Peraturan Dalaman.
Penafian
Maklumat dan penerbitan adalah tidak bertujuan, dan tidak membentuk, nasihat atau cadangan kewangan, pelaburan, dagangan atau jenis lain yang diberikan atau disahkan oleh TradingView. Baca lebih dalam Terma Penggunaan.
Skrip sumber terbuka
Dalam semangat TradingView sebenar, pencipta skrip ini telah menjadikannya sumber terbuka, jadi pedagang boleh menilai dan mengesahkan kefungsiannya. Terima kasih kepada penulis! Walaupuan anda boleh menggunakan secara percuma, ingat bahawa penerbitan semula kod ini tertakluk kepada Peraturan Dalaman.
Penafian
Maklumat dan penerbitan adalah tidak bertujuan, dan tidak membentuk, nasihat atau cadangan kewangan, pelaburan, dagangan atau jenis lain yang diberikan atau disahkan oleh TradingView. Baca lebih dalam Terma Penggunaan.