PROTECTED SOURCE SCRIPT
Telah dikemas kini Quan Money Flow

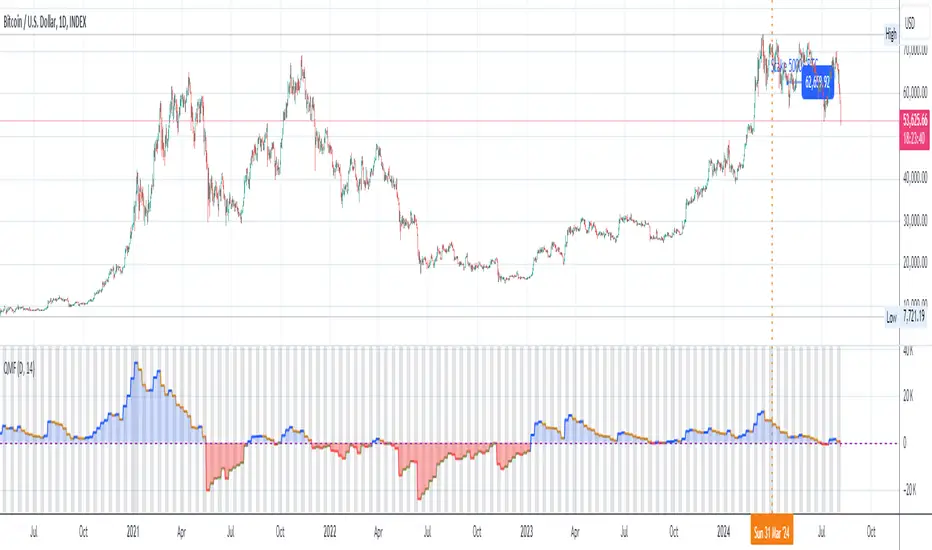
This indicator used to check the power in price and volume while the money going in and out of the market. It takes combination of price power, its direction and volume into consideration.
*** Can be used on long term chart (monthly or weekly) or even short-term one like daily, hourly chart.
*** Indicator colors:
- Red: trend down
- Green: trend up
*** Guide to use this indicator:
- Buy when it is under 0 and starts going up.
- Be hesitate to buy when the indicator is over 0, as your risk is big and the reward is low.
- Always put a stop when you go in the market, as NO indicator can guarantee you 100% correct all the time.
Nota Keluaran
Updated to USD/JPY to have longer view in term of time.Nota Keluaran
Updated UI.Updated buy and sell signal logic.
Nota Keluaran
Add option to use a test price instead of current close price.Nota Keluaran
Update view.Nota Keluaran
Update short name.Nota Keluaran
Update price text.Nota Keluaran
Update chart.Nota Keluaran
Add resolution to reduce the noise of each bar (you still can use the original timeframe if you want too).Can use in any timeframe (5m, 15m, 1H, 1D, 1W, ...) to see the trend.
Note: this script has a small side affect of repainting as it uses resolution. Thus, you might want to wait a little bit before entering a trade.
Nota Keluaran
Add option to reduce the repainting issue.Nota Keluaran
Enhance auto resolution.Auto choose source now.
Skrip dilindungi
Skrip ini diterbitkan sebagai sumber tertutup. Akan tetapi, anda boleh menggunakannya secara bebas dan tanpa apa-apa had – ketahui lebih di sini.
Penafian
Maklumat dan penerbitan adalah tidak bertujuan, dan tidak membentuk, nasihat atau cadangan kewangan, pelaburan, dagangan atau jenis lain yang diberikan atau disahkan oleh TradingView. Baca lebih dalam Terma Penggunaan.