OPEN-SOURCE SCRIPT
Volume 15m vs 1m
*Up/Down Volume Indicator
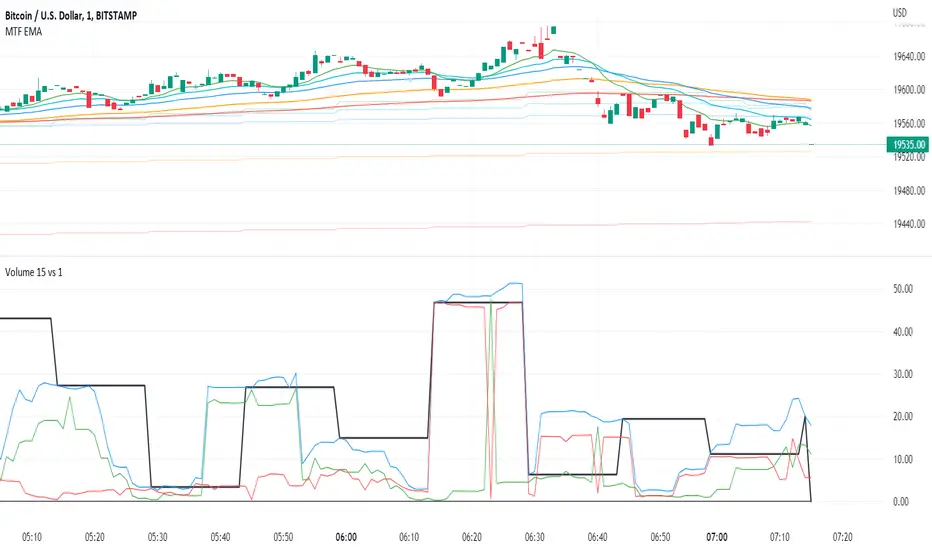
This indicator plots the 15m volume (black line) on the 1m chart alongside the sum of 1m volume for 15m (blue line).
This indicator allows us to see the raw data that will generate the 15m volume before it occurs.
Next it seperates up period volume (green line) from down period volume (red line) so that we can see how much of each was responsible for the total volume.
The black line will dance for 15m at a time but if the blue line rises above the locked in section of the black line (to the left), then the next 15m volume will be higher than the last.
Also, if the green line is higher than the red, we know that up volume is driving of the increase.
*Volume Sum Indicator
This indicator allows us to track the volume trend even when volume is near zero.
This indicators sums the 15m volume for 13 periods to represent 200 minutes worth of volume.
Then it plots the sum of 1m up volume for 200 periods and the 1m down volume for 200 periods.
When green is over red, the volume is trending up.
Blue is the total 1m volume for 200 periods. It should act as a resistance line since it is unusual for 100% of volume to be up volume or down volume.
This indicator only works on the 1m chart. The higher timeframe must be set to 15m. If anyone knows how to make this indicator work on any timeframe that would be great!
Skrip sumber terbuka
Dalam semangat TradingView sebenar, pencipta skrip ini telah menjadikannya sumber terbuka, jadi pedagang boleh menilai dan mengesahkan kefungsiannya. Terima kasih kepada penulis! Walaupuan anda boleh menggunakan secara percuma, ingat bahawa penerbitan semula kod ini tertakluk kepada Peraturan Dalaman.
Penafian
Maklumat dan penerbitan adalah tidak bertujuan, dan tidak membentuk, nasihat atau cadangan kewangan, pelaburan, dagangan atau jenis lain yang diberikan atau disahkan oleh TradingView. Baca lebih dalam Terma Penggunaan.