OPEN-SOURCE SCRIPT
Exponential growth
Purpose
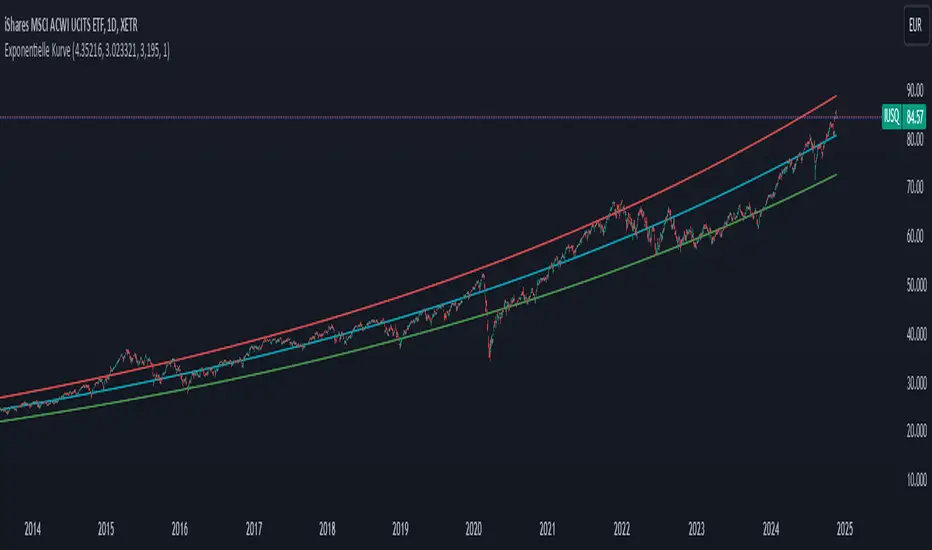
The indicator plots an exponential curve based on historical price data and supports toggling between exponential regression and linear logarithmic regression. It also provides offset bands around the curve for additional insights.
Key Inputs
1. yxlogreg and dlogreg:
These are the "Endwert" (end value) and "Startwert" (start value) for calculating the slope of the logarithmic regression.
2. bars:
Specifies how many historical bars are considered in the calculation.
3.offsetchannel:
Adds an adjustable percentage-based offset to create upper and lower bands around the main exponential curve.
Default: 1 (interpreted as 10% bands).
4.lineareregression log.:
A toggle to switch between exponential function and linear logarithmic regression.
Default: false (exponential is used by default).
5.Dynamic Labels:
Creates a label showing the calculated regression values and historical bars count at the latest bar. The label is updated dynamically.
Use Cases
Exponential Growth Tracking:
Useful for assets or instruments exhibiting exponential growth trends.
Identifying Channels:
Helps identify support and resistance levels using the offset bands.
Switching Analysis Modes:
Flexibility to toggle between exponential and linear logarithmic analysis.
Skrip sumber terbuka
Dalam semangat TradingView sebenar, pencipta skrip ini telah menjadikannya sumber terbuka, jadi pedagang boleh menilai dan mengesahkan kefungsiannya. Terima kasih kepada penulis! Walaupuan anda boleh menggunakan secara percuma, ingat bahawa penerbitan semula kod ini tertakluk kepada Peraturan Dalaman.
Penafian
Maklumat dan penerbitan adalah tidak bertujuan, dan tidak membentuk, nasihat atau cadangan kewangan, pelaburan, dagangan atau jenis lain yang diberikan atau disahkan oleh TradingView. Baca lebih dalam Terma Penggunaan.