OPEN-SOURCE SCRIPT
Telah dikemas kini Big 7 NASDAQ
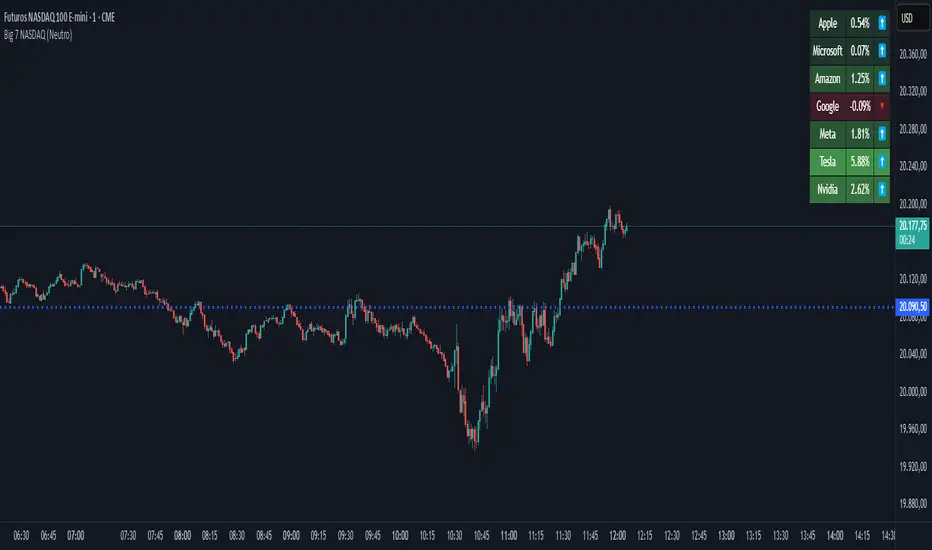
📊 Big 7 NASDAQ % Change Heatmap with Trend Arrows
This indicator displays a real-time performance table for the "Big 7" NASDAQ stocks:
Apple (AAPL), Microsoft (MSFT), Amazon (AMZN), Google (GOOGL), Meta (META), Tesla (TSLA), and Nvidia (NVDA).
🔎 Features:
Live Daily % Change: Calculates the percentage change between today’s open and the current price.
Color Gradient: Background color intensity reflects the strength of the move (from mild to strong bullish/bearish).
Trend Arrows: Visual arrows 🔺 (up) and 🔻 (down) represent the direction of movement.
Position Mode Selector:
"Buy" – highlights with green tones
"Sell" – highlights with red tones
"Neutral" – uses dynamic coloring based on individual stock moves
📍 Placement:
The table is positioned in the top-right corner of the chart for easy reference without cluttering your main view.
Nota Keluaran
✅ Update: Position Context Mode & Dynamic HighlightingThis update introduces a new "Position Type" selector, allowing traders to switch between Buy, Sell, and Neutral modes.
In Buy mode, bullish assets are highlighted with shades of green based on strength.
In Sell mode, bearish assets are emphasized using red gradients.
In Neutral mode, each stock is independently colored based on its own % change.
This enhancement provides a clearer visual focus aligned with your current market bias or trading strategy.
Skrip sumber terbuka
Dalam semangat TradingView sebenar, pencipta skrip ini telah menjadikannya sumber terbuka, jadi pedagang boleh menilai dan mengesahkan kefungsiannya. Terima kasih kepada penulis! Walaupuan anda boleh menggunakan secara percuma, ingat bahawa penerbitan semula kod ini tertakluk kepada Peraturan Dalaman.
Penafian
Maklumat dan penerbitan adalah tidak bertujuan, dan tidak membentuk, nasihat atau cadangan kewangan, pelaburan, dagangan atau jenis lain yang diberikan atau disahkan oleh TradingView. Baca lebih dalam Terma Penggunaan.