OPEN-SOURCE SCRIPT
Historical Monthly Returns Tracker
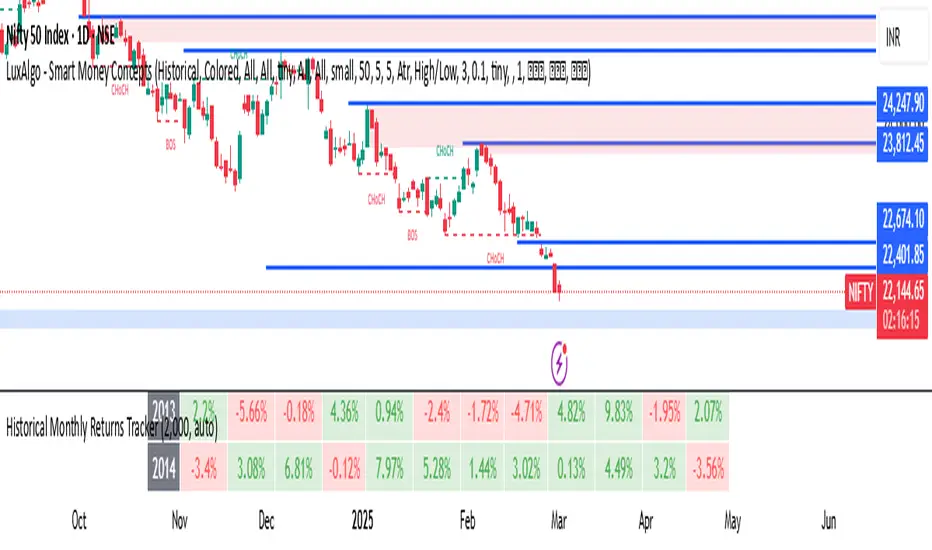
The Historical Monthly Returns Tracker is a powerful Pine Script v5 indicator designed to provide a detailed performance analysis of an asset’s monthly returns over time. It calculates and displays the percentage change for each month, aggregated into a structured table. The indicator helps traders and investors identify seasonal trends, recurring patterns, and historical profitability for a selected asset.
Key Features
✅ Historical Performance Analysis – Tracks monthly percentage changes for any asset.
✅ Customizable Start Year – Users can define the beginning year for data analysis.
✅ Comprehensive Data Table – Displays a structured table with yearly returns per month.
✅ Aggregated Statistics – Shows average return, total sum, number of positive months, and win rate (WR) for each month.
✅ Clear Color Coding – Highlights positive returns in green, negative in red, and neutral in gray.
✅ Works on Daily & Monthly Timeframes – Ensures accurate calculations based on higher timeframes.
How It Works
Data Collection:
The script fetches monthly closing prices.
It calculates month-over-month percentage change.
The values are stored in a matrix for further processing.
Table Generation:
Displays a structured table where each row represents a year, and each column represents a month (Jan–Dec).
Monthly returns are color-coded for easy interpretation.
Aggregated Statistics:
AVG: The average return per month across all available years.
SUM: The total cumulative return for each month.
+ive: The number of times a month had positive performance vs. total occurrences.
WR (Win Rate): The percentage of times a month had a positive return.
Use Cases
📈 Seasonality Analysis: Identify which months historically perform better or worse.
📊 Risk Management: Plan trading strategies based on historical trends.
🔍 Backtesting Aid: Support algorithmic and discretionary traders with real data insights.
🔄 Asset Comparison: Compare different stocks, forex pairs, or cryptocurrencies for their seasonal behavior.
How to Use
Apply the Indicator to a chart in TradingView.
Ensure your timeframe is Daily or Monthly (lower timeframes are not supported).
The table will automatically populate based on available historical data.
Analyze the patterns, trends, and win rates to optimize trading decisions.
Limitations
⚠️ Requires a sufficient amount of historical data to provide accurate analysis.
⚠️ Works best on high-liquidity assets (stocks, indices, forex, crypto).
⚠️ Not a predictive tool but rather a historical performance tracker.
Final Thoughts
The Historical Monthly Returns Tracker is an excellent tool for traders seeking to leverage seasonal trends in their strategies. Whether you're a stock, forex, or crypto trader, this indicator provides clear, data-driven insights to help refine entry and exit points based on historical patterns.
🚀 Use this tool to make smarter, more informed trading decisions!
Skrip sumber terbuka
Dalam semangat TradingView sebenar, pencipta skrip ini telah menjadikannya sumber terbuka, jadi pedagang boleh menilai dan mengesahkan kefungsiannya. Terima kasih kepada penulis! Walaupuan anda boleh menggunakan secara percuma, ingat bahawa penerbitan semula kod ini tertakluk kepada Peraturan Dalaman.
Penafian
Maklumat dan penerbitan adalah tidak bertujuan, dan tidak membentuk, nasihat atau cadangan kewangan, pelaburan, dagangan atau jenis lain yang diberikan atau disahkan oleh TradingView. Baca lebih dalam Terma Penggunaan.