PROTECTED SOURCE SCRIPT
MACD Derivatives

MACD Derivatives v1.1
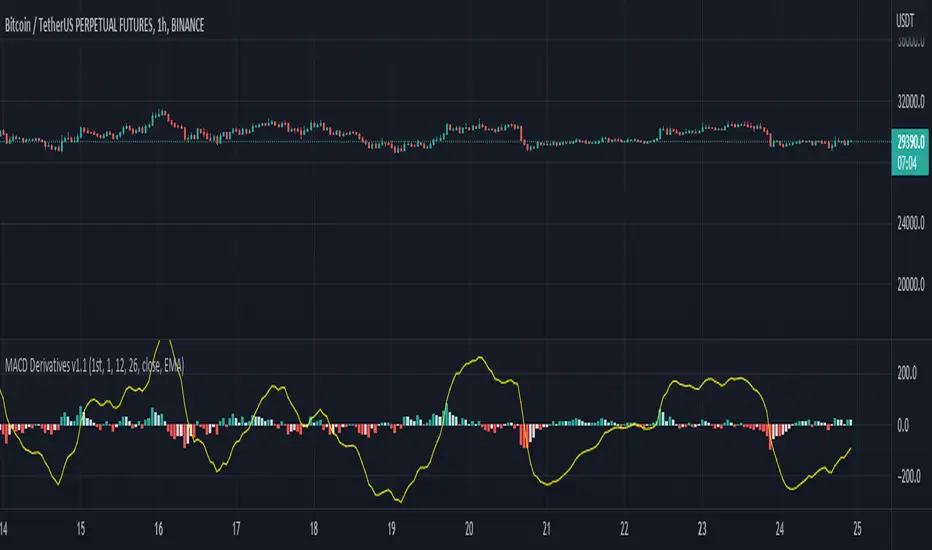
Shows MACD value and derivative of MACD value in the histogram. The histogram shows 1st or 2nd order derivative as indicated in the settings. The derivative value represents the slope, the direction of change and change rate of the MACD value, aiming to give influence on possible trend turns on MACD value, ideally the possible direction change of MACD/price before the actual turn.
- 1st order derivative represents the increase or decrease of the MACD value, shown as positive or negative histogram value respectively;
- Similarly, 2nd order derivative represents the increase or decrease in the difference of the 1st order derivative value, represented via the histogram.
Both of the derivative functions are according to the value difference of n-th bar. The value n is customizable in the settings.
The indicator is based on the source code of built-in MACD indicator excluding the signal and the usual MACD histogram calculations, i.e. the signal is removed and the histogram shows the 1st or 2nd derivative of the MACD value.
For example: You can not get information about the future price via this indicator but some supportive information and visualization on the trend change such as "The uptrend is slowing down, and this slowing down is getting quicker."
Disclaimer: It is NOT recommended to open or close positions based solely on this indicator. The derivative value answers only one question, i.e. the change in last MACD value. Does not indicate any future value and I mean it.
Skrip dilindungi
Skrip ini diterbitkan sebagai sumber tertutup. Akan tetapi, anda boleh menggunakannya secara bebas dan tanpa apa-apa had – ketahui lebih di sini.
Penafian
Maklumat dan penerbitan adalah tidak bertujuan, dan tidak membentuk, nasihat atau cadangan kewangan, pelaburan, dagangan atau jenis lain yang diberikan atau disahkan oleh TradingView. Baca lebih dalam Terma Penggunaan.