OPEN-SOURCE SCRIPT
SMU STDEV Overlap Candles with Highest and Lowest
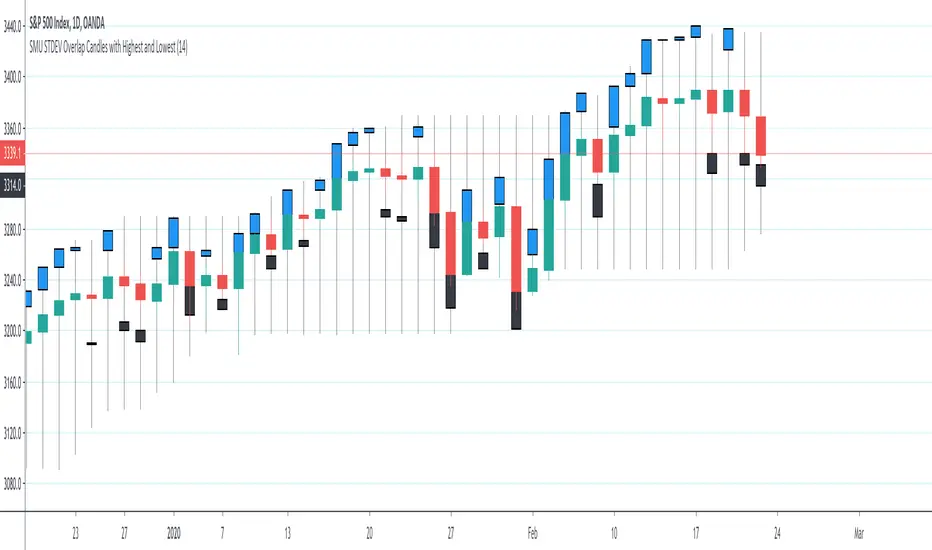
This script creates a STDEV in a candle format overlayed on the actual candles. The STDEV candles lead with deviation to upside or downside.
The Blue bars are Upside heads-up showing the strength of the uptrend before it happens.
The Black candles are downside indicators pulling on the price
I like price action because it is raw. So for High and Low I used the highest and lowest amount so when you trade you can see where the price is in relation to previous high and low
I use this script in conjunction with my first STDEV candles to get the full picture in short time frames. For example, when I see the STDEV of above 6 on change of direction then I trade on it before the trend begins and confirm it with STDEV overlay
If you have you been following my scripts you notice the code is very simple but the concept is very powerful. My hope is better pine script coders to build on these scripts and publish more out of the box type of scripts.
Enjoy
Skrip sumber terbuka
Dalam semangat TradingView sebenar, pencipta skrip ini telah menjadikannya sumber terbuka, jadi pedagang boleh menilai dan mengesahkan kefungsiannya. Terima kasih kepada penulis! Walaupuan anda boleh menggunakan secara percuma, ingat bahawa penerbitan semula kod ini tertakluk kepada Peraturan Dalaman.
Penafian
Maklumat dan penerbitan adalah tidak bertujuan, dan tidak membentuk, nasihat atau cadangan kewangan, pelaburan, dagangan atau jenis lain yang diberikan atau disahkan oleh TradingView. Baca lebih dalam Terma Penggunaan.