OPEN-SOURCE SCRIPT
Telah dikemas kini Momentum (80) + ATR (14)
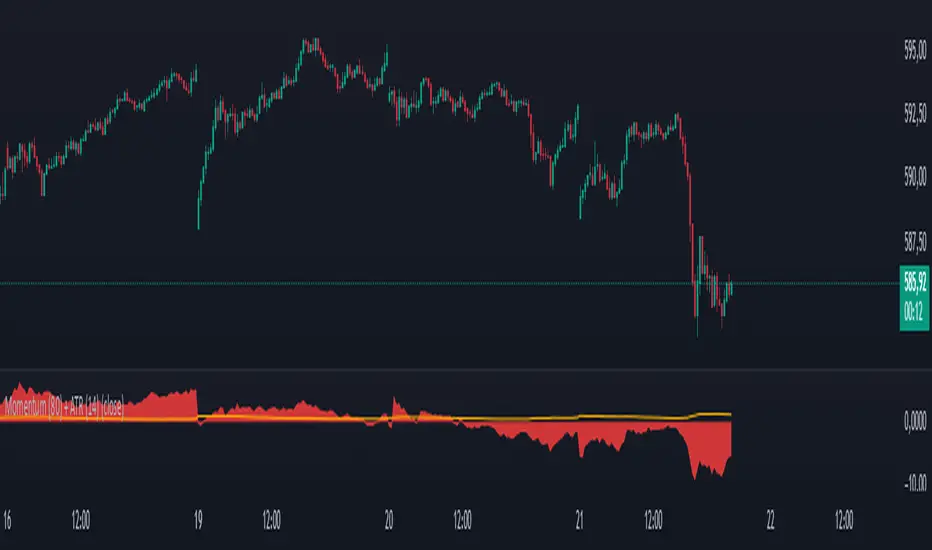
his indicator combines two essential technical analysis tools in a single panel for enhanced market insight:
🔹 Momentum (80 periods): Measures the difference between the current price and the price 80 bars ago. Displayed as a semi-transparent filled area, it helps to visually identify shifts in price momentum over a longer timeframe.
🔸 ATR (Average True Range, 14 periods): Shown as a fine orange line, the ATR represents average market volatility over 14 periods, highlighting phases of calm or increased price fluctuations.
By viewing both momentum and volatility simultaneously, traders can better assess trend strength and market conditions, improving decision-making across assets such as stocks, forex, and cryptocurrencies.
✅ Suitable for all asset types
✅ Complements other indicators like RSI, MACD, and Bollinger Bands
✅ Categorized under Momentum & Volatility indicators
Nota Keluaran
📈 Momentum (80) + ATR (14) IndicatorThis custom indicator combines two essential technical tools—Momentum and Average True Range (ATR)—to help traders better interpret both market directional strength and volatility conditions in a single view.
🔹 Momentum (80)
The momentum component calculates the difference between the current closing price and the closing price 80 periods ago:
Momentum = Close - Close[80].
This long lookback period helps to smooth out noise and highlight sustained movements in price. The result is plotted as a filled area, visually emphasizing strong upward or downward momentum. It’s especially useful for identifying emerging trends or the weakening of existing ones.
🔹 ATR (14)
The Average True Range (ATR), using a standard 14-period setting, is plotted as a single line. It provides a real-time measure of market volatility by calculating the average range between high and low prices, adjusted for gaps.
A dynamic label shows the current ATR value on the latest bar, helping traders quickly assess whether volatility is increasing or contracting—key for position sizing and risk management.
Skrip sumber terbuka
Dalam semangat TradingView sebenar, pencipta skrip ini telah menjadikannya sumber terbuka, jadi pedagang boleh menilai dan mengesahkan kefungsiannya. Terima kasih kepada penulis! Walaupuan anda boleh menggunakan secara percuma, ingat bahawa penerbitan semula kod ini tertakluk kepada Peraturan Dalaman.
Penafian
Maklumat dan penerbitan adalah tidak bertujuan, dan tidak membentuk, nasihat atau cadangan kewangan, pelaburan, dagangan atau jenis lain yang diberikan atau disahkan oleh TradingView. Baca lebih dalam Terma Penggunaan.