PROTECTED SOURCE SCRIPT
Pre-Market & Daily Volume Analysis - BlueThunder
Main Purpose
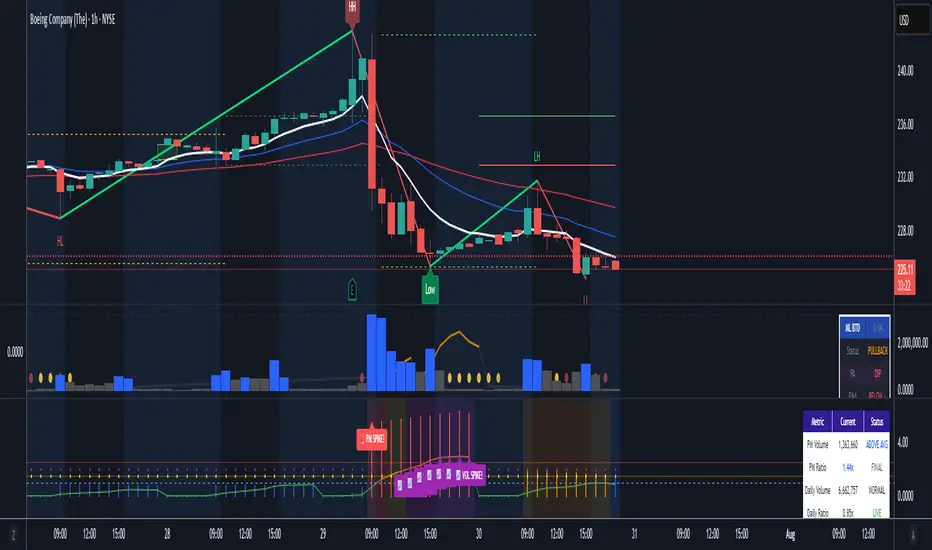
Identifies when pre-market or daily volume is significantly higher than average, which often signals important news, earnings reactions, or institutional activity that could lead to strong price movements.
Key Features
Pre-Market Volume Analysis
Tracks volume accumulation during pre-market hours (default: 4:00 AM - 9:30 AM)
Compares to estimated average pre-market volume (calculated as ~12% of average daily volume)
Shows ratio as blue histogram bars - higher bars = more unusual activity
Daily Volume Tracking
Real-time daily volume accumulation throughout the trading session
Compares current day's volume to 20-day average daily volume
Shows ratio as colored line (green/orange/red based on intensity)
Visual Alerts
Background colors change when volume exceeds thresholds
Reference lines at 1.0x (average), 1.5x (high), and 2.5x+ (very high) levels
Pop-up labels with emojis (🚨📈) for extreme volume spikes
Information Dashboard
Real-time table showing:
Current pre-market volume and ratio
Current daily volume progress vs average
Status indicators (Normal/High/Very High)
Session status (Pre-Market/Market Open)
Live time display
Trading Applications
Morning Routine
Pre-market screening: Quickly spot stocks with unusual overnight activity
Gap identification: High pre-market volume often precedes significant gaps
News reaction: Volume spikes typically indicate breaking news or earnings
Day Trading
Entry timing: High volume breakouts have better follow-through
Risk management: Unusual volume = higher volatility expectations
Momentum confirmation: Volume validates price movement strength
Alert Strategy
Set alerts for 1.5x+ pre-market volume to catch early movers
Watch for sustained high daily volume (continuation signal)
Use as confirmation with other technical indicators
Customization Options
Adjustable pre-market hours for different time zones
Separate thresholds for pre-market vs daily volume
Toggle daily volume display on/off
Customizable averaging period (default: 20 days)
Skrip dilindungi
Skrip ini diterbitkan sebagai sumber tertutup. Akan tetapi, anda boleh menggunakannya secara bebas dan tanpa apa-apa had – ketahui lebih di sini.
Penafian
Maklumat dan penerbitan adalah tidak bertujuan, dan tidak membentuk, nasihat atau cadangan kewangan, pelaburan, dagangan atau jenis lain yang diberikan atau disahkan oleh TradingView. Baca lebih dalam Terma Penggunaan.