OPEN-SOURCE SCRIPT
TRADE ORBIT:VAPI Oscillator with Bullish/Bearish + VWAP.
Components
VAPI Oscillator
Shows the balance of buying vs. selling pressure using price and volume.
Plotted as a histogram (green above zero, red below zero) with a gray oscillator line.
Zero line (gray) acts as the main threshold between bullish and bearish pressure.
Signals
Bullish Signal (▲ BULLISH) → Triggered when VAPI crosses above zero.
Bearish Signal (▼ BEARISH) → Triggered when VAPI crosses below zero.
Alerts are included for automation/notifications.
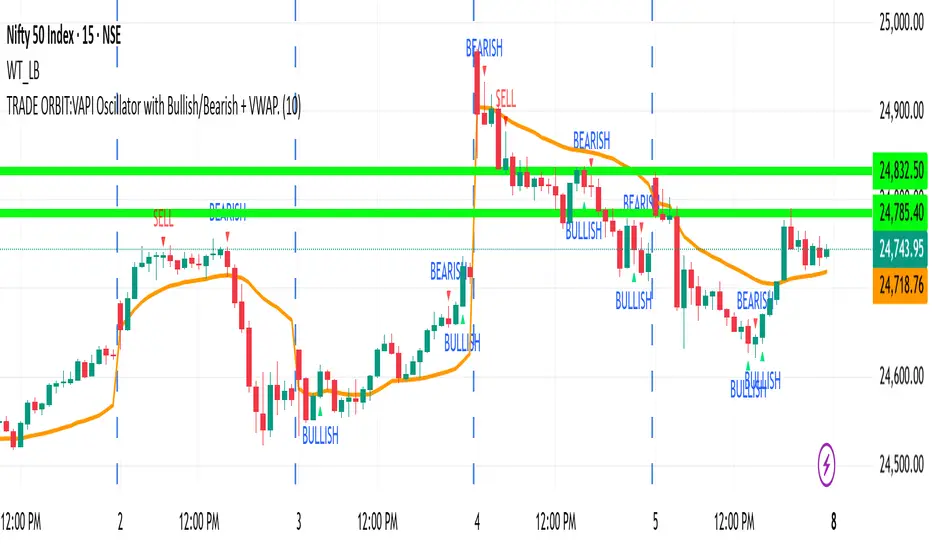
VWAP (Volume Weighted Average Price)
Plotted on the main price chart (orange line).
Resets each new trading day.
Acts as an institutional benchmark for trend and fair value.
🔹 How to Use
When VAPI crosses above zero → market pressure is bullish (look for long opportunities, especially if price is above VWAP).
When VAPI crosses below zero → market pressure is bearish (look for short opportunities, especially if price is below VWAP).
VWAP provides a strong support/resistance zone; confluence between VAPI and VWAP strengthens signals.
VAPI Oscillator
Shows the balance of buying vs. selling pressure using price and volume.
Plotted as a histogram (green above zero, red below zero) with a gray oscillator line.
Zero line (gray) acts as the main threshold between bullish and bearish pressure.
Signals
Bullish Signal (▲ BULLISH) → Triggered when VAPI crosses above zero.
Bearish Signal (▼ BEARISH) → Triggered when VAPI crosses below zero.
Alerts are included for automation/notifications.
VWAP (Volume Weighted Average Price)
Plotted on the main price chart (orange line).
Resets each new trading day.
Acts as an institutional benchmark for trend and fair value.
🔹 How to Use
When VAPI crosses above zero → market pressure is bullish (look for long opportunities, especially if price is above VWAP).
When VAPI crosses below zero → market pressure is bearish (look for short opportunities, especially if price is below VWAP).
VWAP provides a strong support/resistance zone; confluence between VAPI and VWAP strengthens signals.
Skrip sumber terbuka
Dalam semangat sebenar TradingView, pencipta skrip ini telah menjadikannya sumber terbuka supaya pedagang dapat menilai dan mengesahkan kefungsiannya. Terima kasih kepada penulis! Walaupun anda boleh menggunakannya secara percuma, ingat bahawa menerbitkan semula kod ini adalah tertakluk kepada Peraturan Dalaman kami.
Penafian
Maklumat dan penerbitan adalah tidak dimaksudkan untuk menjadi, dan tidak membentuk, nasihat untuk kewangan, pelaburan, perdagangan dan jenis-jenis lain atau cadangan yang dibekalkan atau disahkan oleh TradingView. Baca dengan lebih lanjut di Terma Penggunaan.