snowsilence

Substratum Module [snowsilence]

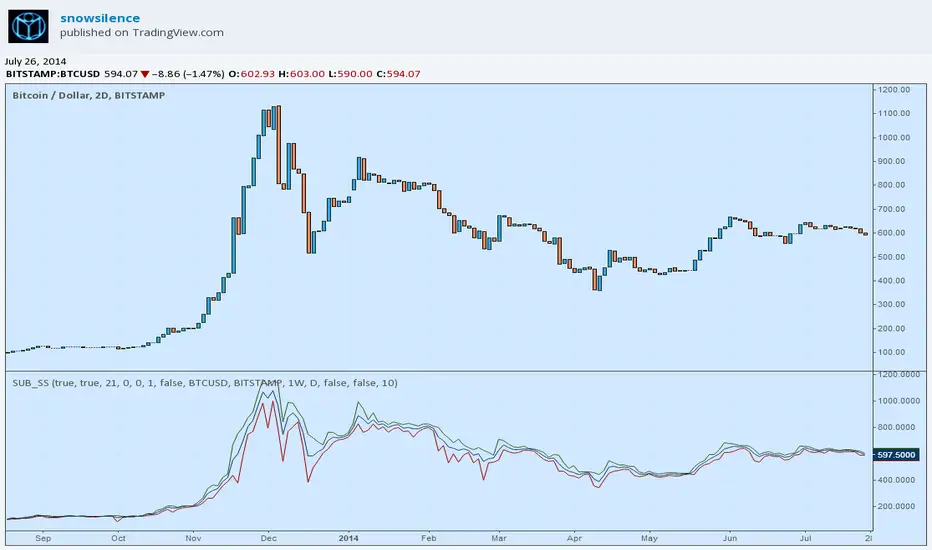
This module is meant to act as a framework and platform over which to develop other indicators. On its own it does essentially nothing, yet simplifies the work of adding basic customizations and flexibility to ideas immediately. The chart on this post is not a demo, so its better to just try adding the indicator to a test chart — you may find it more convenient to set "overlay=true" in the study header — and look into the settings for an intuitive sense of its purpose.

Please build off of this, let me know if you find it useful, and credit/reference me where it seems reasonable. Feedback is always appreciated!
Skrip sumber terbuka

Dalam semangat TradingView yang sebenar, penulis skrip ini telah menerbitkannya dengan menggunakan sumber terbuka supaya pedagang-pedagang dapat memahami dan mengesahkannya. Sorakan kepada penulis! Anda dapat menggunakannya secara percuma tetapi penggunaan semula kod ini dalam penerbitan adalah dikawalselia oleh Peraturan Dalaman. Anda boleh menyukainya untuk menggunakannya pada carta.

Penafian

Maklumat dan penerbitan adalah tidak dimaksudkan untuk menjadi, dan tidak membentuk, nasihat untuk kewangan, pelaburan, perdagangan dan jenis-jenis lain atau cadangan yang dibekalkan atau disahkan oleh TradingView. Baca dengan lebih lanjut di Terma Penggunaan.

Ingin menggunakan skrip ini pada carta?
study("Substratum Module", "SUB_SS", overlay=false)

// This module/sub-indicator — "Substratum" [v0.1] (by snowsilence) — is meant to act
// as a framework and platform over which to develop other indicators.
// On its own it does essentially nothing but simplify the work of adding
// basic customizations and flexibility to ideas immediately. 
// Please build off of this, let me know if you find useful, 
// and credit/reference me where it seems reasonable.
// Feedback is always appreciated.

use_auto = input(true, title = "Auto-sense Security & Interval", type = bool, defval=true)
use_HA = input(true, title = "Use 'Heiken Ashi' Bar Values?", type = bool, defval = true)

length = input(title="Bin Size/Length",defval=21, minval = 1)
lb = input(0, "Series Look-back Depth (n-Bars)", type = integer, minval = 0)
off_set = input(0, "Plot Offset", defval = 0, type = integer)
off_mult = input(1, "Offset Multiplier",minval=1, type=integer)
offset = (off_mult)*(off_set)

use_cti = input(false, title = "Use Custom Parameters? (First Disable Auto-Sense)", type = bool)
SEC_0 = input("BITSTAMP:BTCUSD", "Security", type = symbol) //This is the default security used when 'custom' mode is enabled. It should have been possible to user the built-in variable "tickerid" in the input in place of the string, but there is a bug in the Pine script disallowing this.
TI = use_cti ? input("1W","Interval:", type=string) : input("D", "Default Interval (If None Specified) :", type = resolution)

logW(x,b)=>log(x)/log(b)
use_log=input(false,title="Output Signal Log Base-b",type=bool)
use_pow=input(false,title="XOR Output to bth Power",type=bool)
b=input(10,"b",minval=2,type=float)

SEC = use_HA ? heikenashi(SEC_0) : SEC_0

O = use_auto ? open[lb] : (use_log?(security(SEC, TI, logW(open[lb],b))):use_pow?(security(SEC, TI, pow(open[lb],b))):security(SEC, TI, open[lb]))
H = use_auto ? high[lb] : (use_log?(security(SEC, TI, logW(high[lb],b))):use_pow?(security(SEC, TI, pow(high[lb],b))):security(SEC, TI, high[lb]))
L = use_auto ? low[lb] : (use_log?(security(SEC, TI, logW(low[lb],b))):use_pow?(security(SEC, TI, pow(low[lb],b))):security(SEC, TI, low[lb]))
C = use_auto ? close[lb] : (use_log?(security(SEC, TI, logW(close[lb],b))):use_pow?(security(SEC, TI, pow(close[lb],b))):security(SEC, TI, close[lb]))
A3 = use_auto ? hlc3[lb] : (use_log?(security(SEC, TI, logW(hlc3[lb],b))):use_pow?(security(SEC, TI, pow(hlc3[lb],b))):security(SEC, TI, hlc3[lb]))
A4 = use_auto ? ohlc4[lb] : (use_log?(security(SEC, TI, logW(ohlc4[lb],b))):use_pow?(security(SEC, TI, pow(ohlc4[lb],b))):security(SEC, TI, ohlc4[lb]))

//Basic 'High|OHLC4|Low' Plot Example

plot(L, color = #990000, offset = offset)
plot(H, color = #2B5715, offset = offset)
plot(A4,color = #073763, offset = offset)

//Generalize Traditional Pivots Example (Uncomment below; re-comment above example)

// p = A3
// s_1 = (2*p) - H
// s_2 = p - (H - L)
// s_3 = L - (2 * (H - p))
// r_1= (2*p) - L
// r_2 = p + (H - L)
// r_3 = H + (2 * (p - L))

// plot(p, color=black,offset=offset)
// plot(s_1, color=lime,offset=offset)
// plot(s_2, color=green,offset=offset)
// plot(s_3, color=black,offset=offset)
// plot(r_1, color=red,offset=offset)
// plot(r_2, color=maroon,offset=offset)
// plot(r_3, color=black,offset=offset)