OPEN-SOURCE SCRIPT
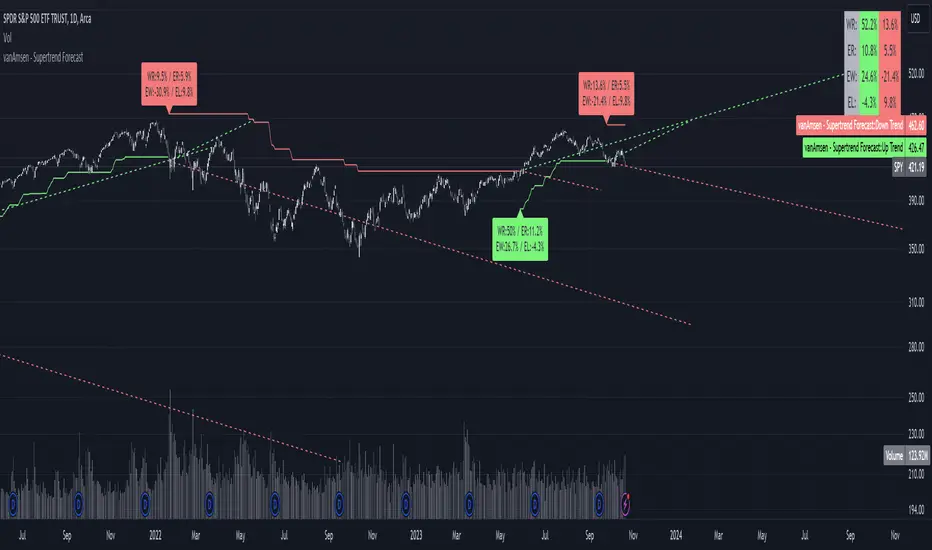
Supertrend Forecast - vanAmsen

Hello everyone!
I am thrilled to present the "vanAmsen - Supertrend Forecast", an advanced tool that marries the simplicity of the Supertrend with comprehensive statistical insights.
Before we dive into the functionalities of this indicator, it's essential to understand its foundation and theory.
The Theory:
What exactly is the Supertrend?
The Supertrend, at its core, is a momentum oscillator. It's a tool that provides buy and sell signals based on the prevailing market trend. The underlying principle is straightforward: by analyzing average price data and volatility over a period, the Supertrend gives us a line that represents the trend direction.
However, trading isn't just about identifying trends; it's about understanding their strength, potential profitability, and historical accuracy. This is where statistics come into play. By incorporating statistical analysis into the Supertrend, we can gain deeper insights into the market's behavior.
Description:
The "vanAmsen - Supertrend Forecast" isn't just another Supertrend indicator. It's a comprehensive tool designed to offer traders a holistic view of market trends, backed by robust statistical analysis.
Key Features:
- Supertrend Line: A visual representation of the current market direction.
- Win Rate & Expected Return: Delve into the historical accuracy and profitability of the prevailing trend.
- Average Percentage Change: Understand the average price fluctuation for both winning and losing trends.
- Forecast Lines: Project future price movements based on historical data, providing a roadmap for potential scenarios.
- Interactive Table: A concise table in the top right, offering a snapshot of all vital metrics at a glance.
Usage:
- The bullish Supertrend line adopts an Aqua hue, indicating potential upward momentum.
- In contrast, the bearish line is painted in Orange, suggesting potential downtrends.
- Customize your chart by toggling labels, tables, and lines according to preference.
Recommendation:
The "vanAmsen - Supertrend Forecast" is undoubtedly a powerful tool in a trader's arsenal. However, it's imperative to combine it with other technical analysis tools and sound risk management practices. It's always prudent to backtest strategies with historical data before embarking on live trading.
Skrip sumber terbuka
Dalam semangat TradingView sebenar, pencipta skrip ini telah menjadikannya sumber terbuka, jadi pedagang boleh menilai dan mengesahkan kefungsiannya. Terima kasih kepada penulis! Walaupuan anda boleh menggunakan secara percuma, ingat bahawa penerbitan semula kod ini tertakluk kepada Peraturan Dalaman.
Penafian
Maklumat dan penerbitan adalah tidak bertujuan, dan tidak membentuk, nasihat atau cadangan kewangan, pelaburan, dagangan atau jenis lain yang diberikan atau disahkan oleh TradingView. Baca lebih dalam Terma Penggunaan.