OPEN-SOURCE SCRIPT
Michael's Custom Watermark
🔷 MICHAEL'S CUSTOM WATERMARK INDICATOR
━━━━━━━━━━━━━━━━━━━━━━━━━━━━━━━━━━━━━━━
📊 OVERVIEW
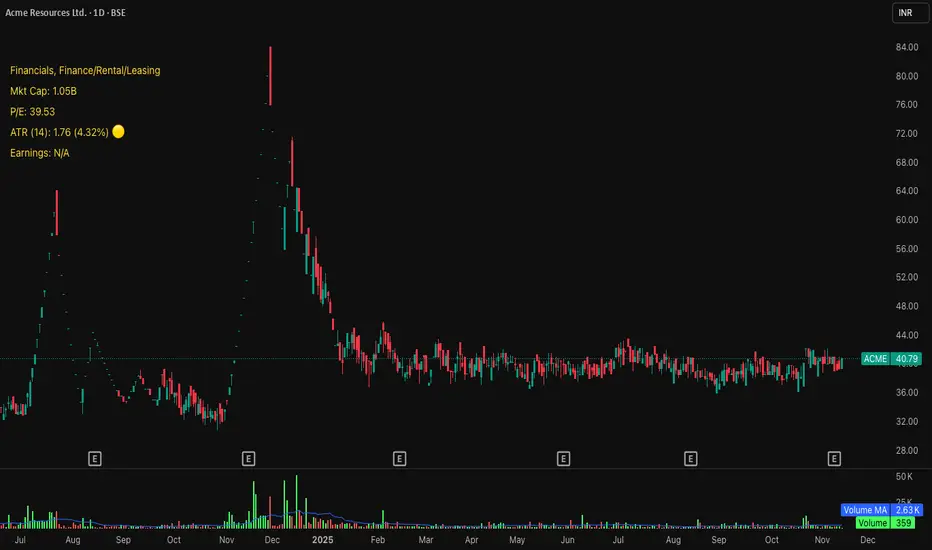
A comprehensive chart watermark overlay that displays essential fundamental and technical information for stocks in a clean, customizable table format. Perfect for traders who want quick access to key metrics without cluttering their charts.
━━━━━━━━━━━━━━━━━━━━━━━━━━━━━━━━━━━━━━━
✨ KEY FEATURES
━━━━━━━━━━━━━━━━━━━━━━━━━━━━━━━━━━━━━━━
🎯 WHAT MAKES THIS INDICATOR UNIQUE?
Unlike basic watermarks, this indicator provides:
━━━━━━━━━━━━━━━━━━━━━━━━━━━━━━━━━━━━━━━
📖 HOW TO USE
1. BASIC SETUP
Add the indicator to your chart. By default, it displays in the top-left corner with all features enabled.
2. POSITIONING
3. CUSTOMIZATION OPTIONS
TEXT APPEARANCE:
DATA DISPLAY TOGGLES:
4. ATR VOLATILITY ALERTS
Configure custom thresholds to monitor volatility:
━━━━━━━━━━━━━━━━━━━━━━━━━━━━━━━━━━━━━━━
📐 UNDERSTANDING THE DISPLAY
🏢 SECTOR & INDUSTRY
Shows the GICS sector classification followed by the specific industry. The indicator uses heuristic-based mapping to align TradingView sectors with standard GICS classifications. Note that this mapping is based on keyword detection and industry analysis, so while generally accurate, it may not perfectly match official GICS classifications in all cases.
💰 MARKET CAP
Displays market capitalization using standard abbreviations:
📊 P/E RATIO
Shows the trailing twelve-month Price-to-Earnings ratio. Only displayed for stocks when enabled. Shows "N/A" if data is unavailable.
📈 ATR (14-DAY)
Displays the 14-period Average True Range in both absolute value and percentage terms, with a color-coded indicator:
📅 EARNINGS
Shows earnings information in three formats:
━━━━━━━━━━━━━━━━━━━━━━━━━━━━━━━━━━━━━━━
⚙️ TECHNICAL DETAILS
SUPPORTED INSTRUMENTS:
PERFORMANCE:
COMPATIBILITY:
━━━━━━━━━━━━━━━━━━━━━━━━━━━━━━━━━━━━━━━
💡 TIPS & BEST PRACTICES
━━━━━━━━━━━━━━━━━━━━━━━━━━━━━━━━━━━━━━━
🔧 TROUBLESHOOTING
"N/A" SHOWING FOR P/E RATIO:
EARNINGS SHOWING "N/A":
TEXT COLOR NOT VISIBLE:
━━━━━━━━━━━━━━━━━━━━━━━━━━━━━━━━━━━━━━━
⚠️ DISCLAIMER
This indicator is for informational purposes only. The fundamental data displayed is sourced from TradingView's data providers. Always verify critical information before making trading decisions. Past performance is not indicative of future results.
━━━━━━━━━━━━━━━━━━━━━━━━━━━━━━━━━━━━━━━
If you find this indicator helpful, please give it a boost 🚀 and share your feedback in the comments!
Version: 1.0
Pine Script Version: v6
Created by: Michael
━━━━━━━━━━━━━━━━━━━━━━━━━━━━━━━━━━━━━━━
📊 OVERVIEW
A comprehensive chart watermark overlay that displays essential fundamental and technical information for stocks in a clean, customizable table format. Perfect for traders who want quick access to key metrics without cluttering their charts.
━━━━━━━━━━━━━━━━━━━━━━━━━━━━━━━━━━━━━━━
✨ KEY FEATURES
- 📊 Fundamental Data Display — Shows Industry, Sector, Market Cap, and P/E Ratio
- 📅 Earnings Information — Displays next earnings date with countdown timer
- 📈 ATR Volatility Indicator — 14-day ATR with color-coded visual alerts (🔴🟡🟢)
- 🎨 Auto Theme Detection — Automatically adjusts text color based on chart background
- ⚙️ Fully Customizable — Position, colors, size, and displayed metrics all adjustable
- 🏢 GICS Sector Mapping — Heuristic-based sector classification aligned with industry standards
━━━━━━━━━━━━━━━━━━━━━━━━━━━━━━━━━━━━━━━
🎯 WHAT MAKES THIS INDICATOR UNIQUE?
Unlike basic watermarks, this indicator provides:
- Real-time fundamental data integration
- Smart theme-aware color adaptation for both light and dark charts
- Configurable volatility alerts using ATR thresholds
- Earnings countdown feature to never miss important dates
- Optimized display that only shows relevant data for the current symbol type
━━━━━━━━━━━━━━━━━━━━━━━━━━━━━━━━━━━━━━━
📖 HOW TO USE
1. BASIC SETUP
Add the indicator to your chart. By default, it displays in the top-left corner with all features enabled.
2. POSITIONING
- Vertical Location: Top, Middle, or Bottom
- Horizontal Location: Left, Center, or Right
- Vertical Offset: Fine-tune position with 0-50 pixel offset from top
3. CUSTOMIZATION OPTIONS
TEXT APPEARANCE:
- Auto Text Color — Enable to automatically adapt text color to your chart theme
- Manual Color — Set a fixed text color if auto-color is disabled
- Text Size — Choose from Huge, Large, Normal, or Small
- Theme Colors — Customize text color for light and dark backgrounds separately
DATA DISPLAY TOGGLES:
- Show Industry & Sector — Display heuristic-based GICS-aligned sector and industry classification
- Show Market Cap — View market capitalization in T/B/M format
- Show P/E Ratio — Display Price-to-Earnings ratio (stocks only)
- Show ATR (14-Day) — Display Average True Range with percentage and visual indicator
- Show Next Earnings — Display upcoming earnings information
- Show Earnings Countdown — Show days remaining until next earnings (requires earnings display)
4. ATR VOLATILITY ALERTS
Configure custom thresholds to monitor volatility:
- Red Threshold — ATR percentage that triggers red alert 🔴 (default: 6%)
- Yellow Threshold — ATR percentage that triggers yellow alert 🟡 (default: 3%)
- Green — Shows automatically when ATR is below yellow threshold 🟢
━━━━━━━━━━━━━━━━━━━━━━━━━━━━━━━━━━━━━━━
📐 UNDERSTANDING THE DISPLAY
🏢 SECTOR & INDUSTRY
Shows the GICS sector classification followed by the specific industry. The indicator uses heuristic-based mapping to align TradingView sectors with standard GICS classifications. Note that this mapping is based on keyword detection and industry analysis, so while generally accurate, it may not perfectly match official GICS classifications in all cases.
💰 MARKET CAP
Displays market capitalization using standard abbreviations:
- T = Trillion
- B = Billion
- M = Million
📊 P/E RATIO
Shows the trailing twelve-month Price-to-Earnings ratio. Only displayed for stocks when enabled. Shows "N/A" if data is unavailable.
📈 ATR (14-DAY)
Displays the 14-period Average True Range in both absolute value and percentage terms, with a color-coded indicator:
- 🔴 Red: High volatility (above red threshold)
- 🟡 Yellow: Moderate volatility (between yellow and red thresholds)
- 🟢 Green: Low volatility (below yellow threshold)
📅 EARNINGS
Shows earnings information in three formats:
- "X days remaining" — When countdown is enabled and earnings date is known
- "Upcoming" — When date is in the future but countdown is disabled
- "Recently Reported" — When earnings just occurred
- "N/A" — When no earnings data is available
━━━━━━━━━━━━━━━━━━━━━━━━━━━━━━━━━━━━━━━
⚙️ TECHNICAL DETAILS
SUPPORTED INSTRUMENTS:
- Optimized for stocks with full fundamental data
- Works with other instruments (crypto, forex, futures) but only displays applicable metrics
- Automatically suppresses irrelevant data (e.g., P/E for non-stocks)
PERFORMANCE:
- Lightweight overlay with minimal resource usage
- Updates only on last bar for efficiency
- No historical recalculation needed
COMPATIBILITY:
- Pine Script v6
- Works on all timeframes
- Compatible with all chart types
- Auto-adapts to theme changes
━━━━━━━━━━━━━━━━━━━━━━━━━━━━━━━━━━━━━━━
💡 TIPS & BEST PRACTICES
- Enable Auto Text Color for seamless theme switching between light and dark modes
- Adjust vertical offset to avoid overlap with price action in high-volatility periods
- Use ATR thresholds appropriate to your trading style and asset class
- Disable features you don't use to keep the watermark clean and focused
- Position in corners to maximize chart viewing space
- Use smaller text size for multi-panel layouts
━━━━━━━━━━━━━━━━━━━━━━━━━━━━━━━━━━━━━━━
🔧 TROUBLESHOOTING
"N/A" SHOWING FOR P/E RATIO:
- This is normal for non-stock instruments
- May occur for stocks with negative earnings
- Check if fundamental data is available for the symbol
EARNINGS SHOWING "N/A":
- Earnings data may not be available for all stocks
- Check TradingView's data coverage for your symbol
TEXT COLOR NOT VISIBLE:
- Enable Auto Text Color feature
- Manually set text color to contrast with your chart background
- Adjust custom light/dark text colors in settings
━━━━━━━━━━━━━━━━━━━━━━━━━━━━━━━━━━━━━━━
⚠️ DISCLAIMER
This indicator is for informational purposes only. The fundamental data displayed is sourced from TradingView's data providers. Always verify critical information before making trading decisions. Past performance is not indicative of future results.
━━━━━━━━━━━━━━━━━━━━━━━━━━━━━━━━━━━━━━━
If you find this indicator helpful, please give it a boost 🚀 and share your feedback in the comments!
Version: 1.0
Pine Script Version: v6
Created by: Michael
Skrip sumber terbuka
Dalam semangat TradingView sebenar, pencipta skrip ini telah menjadikannya sumber terbuka, jadi pedagang boleh menilai dan mengesahkan kefungsiannya. Terima kasih kepada penulis! Walaupuan anda boleh menggunakan secara percuma, ingat bahawa penerbitan semula kod ini tertakluk kepada Peraturan Dalaman.
Penafian
Maklumat dan penerbitan adalah tidak bertujuan, dan tidak membentuk, nasihat atau cadangan kewangan, pelaburan, dagangan atau jenis lain yang diberikan atau disahkan oleh TradingView. Baca lebih dalam Terma Penggunaan.