OPEN-SOURCE SCRIPT
ShadowStats vs Official CPI YoY%
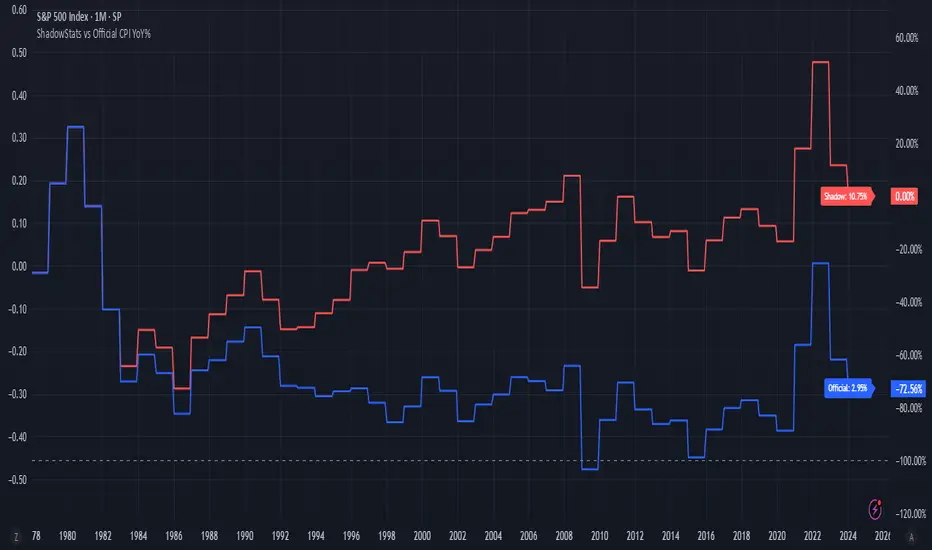
This chart visualizes and compares the year-over-year (YoY) percentage change in the Consumer Price Index (CPI) as calculated by the U.S. government versus the alternative methodology used by ShadowStats, which reflects pre-1980 inflation measurement techniques. The red line represents ShadowStats' CPI YoY% estimates, while the blue line shows the official CPI YoY% reported by government sources. This side-by-side view highlights the divergence in reported inflation rates over time, particularly from the 1980s onward, offering a visual representation of how different calculation methods can lead to vastly different interpretations of inflation and purchasing power loss.
Skrip sumber terbuka
Dalam semangat TradingView sebenar, pencipta skrip ini telah menjadikannya sumber terbuka, jadi pedagang boleh menilai dan mengesahkan kefungsiannya. Terima kasih kepada penulis! Walaupuan anda boleh menggunakan secara percuma, ingat bahawa penerbitan semula kod ini tertakluk kepada Peraturan Dalaman.
Penafian
Maklumat dan penerbitan adalah tidak bertujuan, dan tidak membentuk, nasihat atau cadangan kewangan, pelaburan, dagangan atau jenis lain yang diberikan atau disahkan oleh TradingView. Baca lebih dalam Terma Penggunaan.