PROTECTED SOURCE SCRIPT
Telah dikemas kini Higher Timeframe Candle Overlay
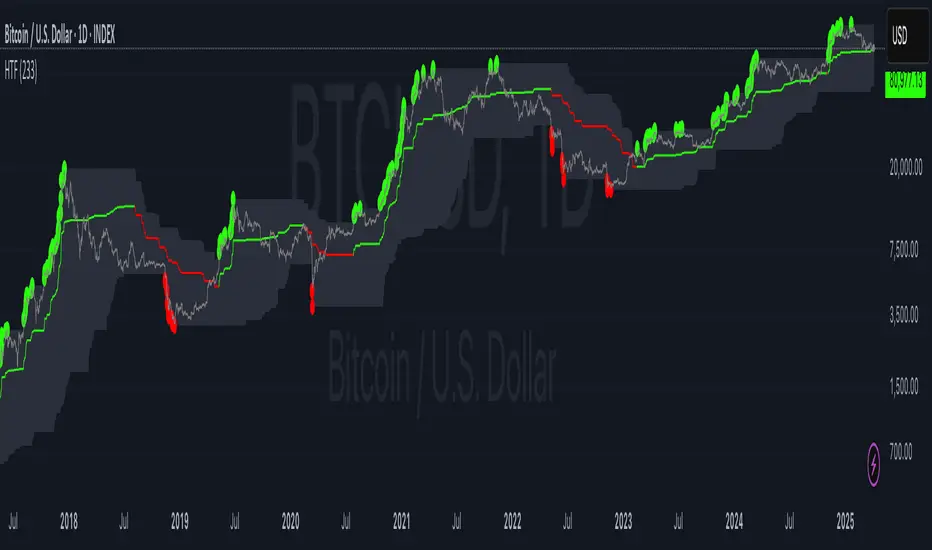
Hi all, this script helps you to see candle of any timeframe at the same time. It is possible to find the regions of dying trend by peeking into the higher timeframe candles. For example, on a 1-min chart, a 1439 min ( (24*60) - 1 ) candle is a day candle refernce to that 1-min. If huge bodied candles starts to grow larger wicks and smaller bodies, it means that the trend is dying.
Nota Keluaran
- Optimised code
- Cleaned up charting
Nota Keluaran
Added colouring inputDisplayed higher timeframe candle's Bullish Highs, Bearish Lows and Median price levels
Nota Keluaran
- Displayed HTF Candles based areas of lower and higher prices
Nota Keluaran
- Fixed typos
Nota Keluaran
Updated to PineScript v6Nota Keluaran
+Added colours for median lineSkrip dilindungi
Skrip ini diterbitkan sebagai sumber tertutup. Akan tetapi, anda boleh menggunakannya secara bebas dan tanpa apa-apa had – ketahui lebih di sini.
Penafian
Maklumat dan penerbitan adalah tidak bertujuan, dan tidak membentuk, nasihat atau cadangan kewangan, pelaburan, dagangan atau jenis lain yang diberikan atau disahkan oleh TradingView. Baca lebih dalam Terma Penggunaan.
Skrip dilindungi
Skrip ini diterbitkan sebagai sumber tertutup. Akan tetapi, anda boleh menggunakannya secara bebas dan tanpa apa-apa had – ketahui lebih di sini.
Penafian
Maklumat dan penerbitan adalah tidak bertujuan, dan tidak membentuk, nasihat atau cadangan kewangan, pelaburan, dagangan atau jenis lain yang diberikan atau disahkan oleh TradingView. Baca lebih dalam Terma Penggunaan.