PROTECTED SOURCE SCRIPT
LevelUp^ Up On Volume Screener
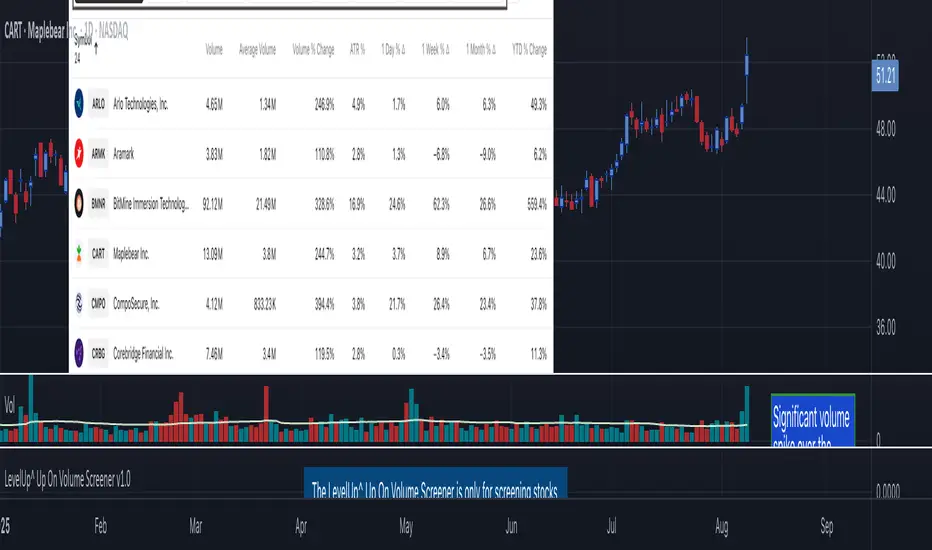
The Up On Volume Screener is a powerful scanner designed to identify stocks exhibiting strong bullish momentum, characterized by a higher close on the day or week accompanied by a significant spike in trading volume compared to the average. This screener allows traders to customize parameters such as moving average lengths, closing range requirements, and proximity to 52-week highs using multiples of the ATR (average true range).
By pinpointing stocks with robust buying pressure and high volume, the Up On Volume screener helps traders uncover potential breakout opportunities, early trend leaders, and stocks demonstrating relative strength, making it an essential tool for momentum, swing, and growth trading strategies.
🔹 Why Search For Up On Volume?
▪ Confirmation of Bullish Momentum: Stocks that close higher on the day/week signal buying pressure and bullish sentiment throughout the session. This helps traders and investors identify names that are attracting demand, possibly due to news, earnings, or sector strength.
▪ Volume Adds Conviction: When a stock closes up with increased volume, it suggests strong participation behind the move — not just a “head fake” or a thinly traded rally. High volume confirms that institutional players or multiple market participants are involved, which often leads to more reliable price trends.
▪ Early Stage Moves: Daily breakouts can often mark the beginning of a larger trend. Catching stocks on days they close up helps pinpoint emerging leaders and stocks transitioning from accumulation to bullish phases.
▪ Technical Strength: A bullish close (especially in the top half of the day’s price range) is a technical sign of demand. This is a favored criterion in many technical analysis strategies for swing trading, momentum trading, and even fundamental breakouts.

🔹 When Is Up On Volume Screen Most Helpful?
▪ After Market Close: Stocks that show strength and close up on high volume often show continued follow-through in the coming days/weeks.
▪ After Major News/Events: When stocks respond positively to news releases, earnings, or sector movements, searching for those that close up can help you catch momentum before it’s widely recognized.
▪ Trend Days: On days when the market is trending (not sideways or choppy), screening for stocks closing up helps you align with the strongest moves and avoid false signals.
▪ Early in Bullish Cycles: Searching for stocks closing up during the early stage of a market rally or sector rotation can help growth traders get in ahead of sustained upward moves.a
▪ Relative Strength Signals True Leadership: When most stocks decline in a weak market, those that hold firm or rise are showing clear relative strength. This means buyers are stepping in even when the broader mood is negative, often signaling institutional accumulation — these are the names likely to become tomorrow’s winners.
▪ Early Clues to New Cycles: Throughout history, the biggest winners in bull markets often began their runs during corrections and bear phases, not after the headlines turn positive. By focusing on stocks that close green on red days, you’re hunting for companies quietly building buying pressure, poised to break out when the tide turns.
▪ Faster Recoveries and Outperformance: Stocks that resist declines tend to rebound earlier and outpace the broader market once conditions improve. These resilient names frequently end up delivering outsized returns, often leading sector rallies or driving new market themes.
🔹 Screening Features - Setting Your Search Criteria
There are various search options that can be customized.
✓ Volume Gap Up %: Minimum volume percent change over the average volume.
✓ Moving Average: Set length for average volume calculations on daily and weekly timeframes.
✓ Closing Range %: Specify the preferred closing range on the day or week.
✓ Price With X ATR of 52-Week High: Filter for stocks within X ATRs of their 52-week highs.
🔹 Installation And Usage
▪ Mark this indicator as a Favorite.
▪ Use the Pine Screener to search for stocks.
▪ Save the search results to a watchlist.
▪ View the watchlist in TradingView.
🔹 Note
Some high-volume breakout scans rely on proprietary formulas. With this screener, every filter can be researched and verified - no black box! The only variables are price, volume % change, closing range and price within a specified ATR of the 52-week high.
By pinpointing stocks with robust buying pressure and high volume, the Up On Volume screener helps traders uncover potential breakout opportunities, early trend leaders, and stocks demonstrating relative strength, making it an essential tool for momentum, swing, and growth trading strategies.
🔹 Why Search For Up On Volume?
▪ Confirmation of Bullish Momentum: Stocks that close higher on the day/week signal buying pressure and bullish sentiment throughout the session. This helps traders and investors identify names that are attracting demand, possibly due to news, earnings, or sector strength.
▪ Volume Adds Conviction: When a stock closes up with increased volume, it suggests strong participation behind the move — not just a “head fake” or a thinly traded rally. High volume confirms that institutional players or multiple market participants are involved, which often leads to more reliable price trends.
▪ Early Stage Moves: Daily breakouts can often mark the beginning of a larger trend. Catching stocks on days they close up helps pinpoint emerging leaders and stocks transitioning from accumulation to bullish phases.
▪ Technical Strength: A bullish close (especially in the top half of the day’s price range) is a technical sign of demand. This is a favored criterion in many technical analysis strategies for swing trading, momentum trading, and even fundamental breakouts.
🔹 When Is Up On Volume Screen Most Helpful?
▪ After Market Close: Stocks that show strength and close up on high volume often show continued follow-through in the coming days/weeks.
▪ After Major News/Events: When stocks respond positively to news releases, earnings, or sector movements, searching for those that close up can help you catch momentum before it’s widely recognized.
▪ Trend Days: On days when the market is trending (not sideways or choppy), screening for stocks closing up helps you align with the strongest moves and avoid false signals.
▪ Early in Bullish Cycles: Searching for stocks closing up during the early stage of a market rally or sector rotation can help growth traders get in ahead of sustained upward moves.a
▪ Relative Strength Signals True Leadership: When most stocks decline in a weak market, those that hold firm or rise are showing clear relative strength. This means buyers are stepping in even when the broader mood is negative, often signaling institutional accumulation — these are the names likely to become tomorrow’s winners.
▪ Early Clues to New Cycles: Throughout history, the biggest winners in bull markets often began their runs during corrections and bear phases, not after the headlines turn positive. By focusing on stocks that close green on red days, you’re hunting for companies quietly building buying pressure, poised to break out when the tide turns.
▪ Faster Recoveries and Outperformance: Stocks that resist declines tend to rebound earlier and outpace the broader market once conditions improve. These resilient names frequently end up delivering outsized returns, often leading sector rallies or driving new market themes.
🔹 Screening Features - Setting Your Search Criteria
There are various search options that can be customized.
✓ Volume Gap Up %: Minimum volume percent change over the average volume.
✓ Moving Average: Set length for average volume calculations on daily and weekly timeframes.
✓ Closing Range %: Specify the preferred closing range on the day or week.
✓ Price With X ATR of 52-Week High: Filter for stocks within X ATRs of their 52-week highs.
🔹 Installation And Usage
▪ Mark this indicator as a Favorite.
▪ Use the Pine Screener to search for stocks.
▪ Save the search results to a watchlist.
▪ View the watchlist in TradingView.
🔹 Note
Some high-volume breakout scans rely on proprietary formulas. With this screener, every filter can be researched and verified - no black box! The only variables are price, volume % change, closing range and price within a specified ATR of the 52-week high.
Skrip dilindungi
Skrip ini diterbitkan sebagai sumber tertutup. Akan tetapi, anda boleh menggunakannya dengan percuma dan tanpa had – ketahui lebih lanjut di sini.
Access our premium tools: LevelUpTools.net
Join traders in over 40 countries and LevelUp!
Join traders in over 40 countries and LevelUp!
Penafian
Maklumat dan penerbitan adalah tidak dimaksudkan untuk menjadi, dan tidak membentuk, nasihat untuk kewangan, pelaburan, perdagangan dan jenis-jenis lain atau cadangan yang dibekalkan atau disahkan oleh TradingView. Baca dengan lebih lanjut di Terma Penggunaan.