OPEN-SOURCE SCRIPT
Mayer Multiple (with muti-color histogram)
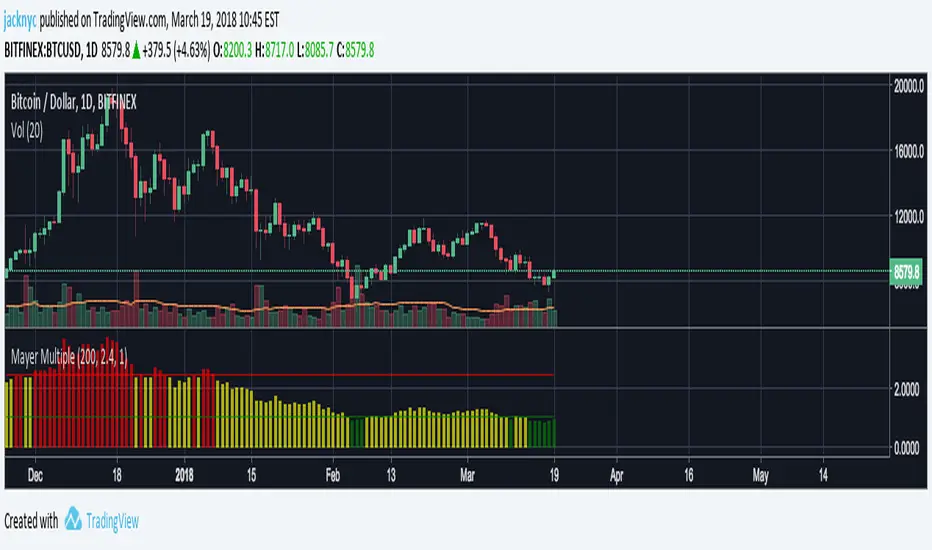
This is inspired by unbound's work on the Mayer Multiple script.
This script is designed to work with the daily chart.

I created this script so you can see the daily Mayer Multiple by just hovering over the bar in the histogram. I modified the color of the histogram bar to indicate the following:
Red = Over 2.4x Mayer Multiple, overvalued
Yellow = Between 1x to 2.4x Mayer Mutiple, fairly valued
Green = Under 1x Mayer Multiple, undervalued
This is my first script so let me know if there are any issues or suggestions on how to change it.
This script is designed to work with the daily chart.
I created this script so you can see the daily Mayer Multiple by just hovering over the bar in the histogram. I modified the color of the histogram bar to indicate the following:
Red = Over 2.4x Mayer Multiple, overvalued
Yellow = Between 1x to 2.4x Mayer Mutiple, fairly valued
Green = Under 1x Mayer Multiple, undervalued
This is my first script so let me know if there are any issues or suggestions on how to change it.
Skrip sumber terbuka
Dalam semangat TradingView sebenar, pencipta skrip ini telah menjadikannya sumber terbuka, jadi pedagang boleh menilai dan mengesahkan kefungsiannya. Terima kasih kepada penulis! Walaupuan anda boleh menggunakan secara percuma, ingat bahawa penerbitan semula kod ini tertakluk kepada Peraturan Dalaman.
Penafian
Maklumat dan penerbitan adalah tidak bertujuan, dan tidak membentuk, nasihat atau cadangan kewangan, pelaburan, dagangan atau jenis lain yang diberikan atau disahkan oleh TradingView. Baca lebih dalam Terma Penggunaan.