OPEN-SOURCE SCRIPT
Telah dikemas kini Hyperbolic Tangent SuperTrend [InvestorUnknown]
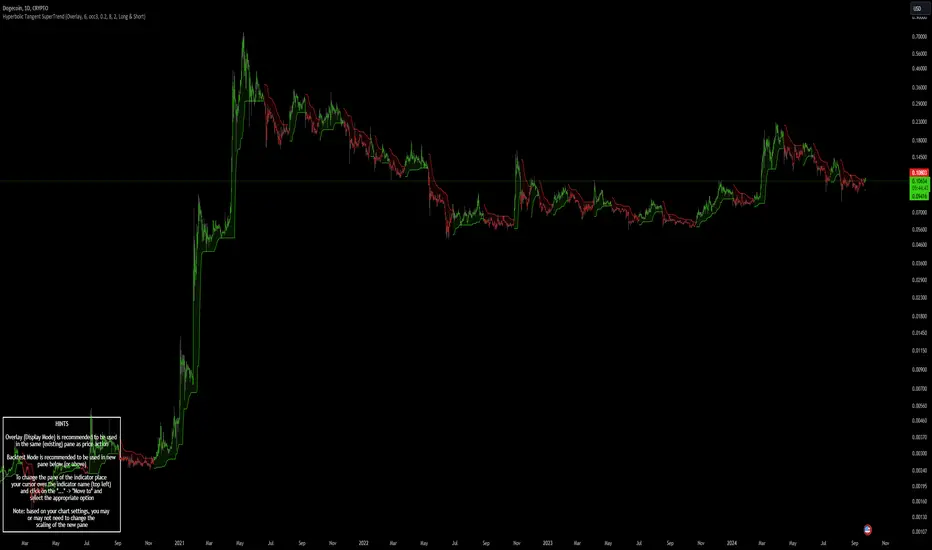
The Hyperbolic Tangent SuperTrend (HTST) is designed for technical analysis, particularly in markets with assets that have lower prices or price ratios. This indicator leverages the Hyperbolic Tangent Moving Average (HTMA), a custom moving average calculated using the hyperbolic tangent function, to smooth price data and reduce the impact of short-term volatility.
Hyperbolic Tangent Moving Average (HTMA):

Pine Script®
The HTMA is calculated by taking the difference between the price and its simple moving average (SMA), applying a multiplier to control sensitivity, and then transforming it using the hyperbolic tangent function.
Pine Script®
Important Note: The Hyperbolic Tangent function becomes less accurate with very high prices. For assets priced above 100,000, the results may deteriorate, and for prices exceeding 1 million, the function may stop functioning properly. Therefore, this indicator is better suited for assets with lower prices or lower price ratios.
SuperTrend Calculation:
Pine Script®
Inbuilt Backtest Mode:


Hint Table for Display Modes:
With these features, the Hyperbolic Tangent SuperTrend Indicator offers traders a versatile and customizable tool for analyzing price trends while providing additional functionalities like backtesting and display mode hints for optimal usability.
Hyperbolic Tangent Moving Average (HTMA):
- The indicator's core uses a hyperbolic tangent function to calculate a smoothed average of the price. The HTMA provides enhanced trend-following capabilities by dampening the impact of sharp price swings and maintaining a focus on long-term market movements.
- The hyperbolic tangent function (tanh) is commonly used in mathematical fields like calculus, machine learning and signal processing due to its properties of “squashing” inputs into a range between -1 and 1. The function provides a non-linear transformation that can reduce the impact of extreme values while retaining a certain level of smoothness.
tanh(x) =>
e_x = math.exp(x)
e_neg_x = math.exp(-x)
(e_x - e_neg_x) / (e_x + e_neg_x)
The HTMA is calculated by taking the difference between the price and its simple moving average (SMA), applying a multiplier to control sensitivity, and then transforming it using the hyperbolic tangent function.
htma(src, len, mul) =>
tanh_src = tanh((src - ta.sma(src, len)) * mul) * ta.stdev(src, len) + ta.sma(src, len)
htma = ta.sma(tanh_src, len)
Important Note: The Hyperbolic Tangent function becomes less accurate with very high prices. For assets priced above 100,000, the results may deteriorate, and for prices exceeding 1 million, the function may stop functioning properly. Therefore, this indicator is better suited for assets with lower prices or lower price ratios.
SuperTrend Calculation:
- In addition to the HTMA, the indicator includes an Average True Range (ATR)-based SuperTrend calculation, which helps identify uptrends and downtrends in the market. The SuperTrend is adjusted dynamically using the HTMA to avoid false signals in fast-moving markets.
- The ATR period and multiplier are customizable, allowing users to fine-tune the sensitivity of the trend signals.
pine_supertrend(src, calc_price, atrPeriod, factor) =>
atr = ta.atr(atrPeriod)
upperBand = src + factor * atr
lowerBand = src - factor * atr
prevLowerBand = nz(lowerBand[1])
prevUpperBand = nz(upperBand[1])
lowerBand := lowerBand > prevLowerBand or calc_price[1] < prevLowerBand ? lowerBand : prevLowerBand
upperBand := upperBand < prevUpperBand or calc_price[1] > prevUpperBand ? upperBand : prevUpperBand
int _direction = na
float superTrend = na
prevSuperTrend = superTrend[1]
if na(atr[1])
_direction := 1
else if prevSuperTrend == prevUpperBand
_direction := calc_price > upperBand ? -1 : 1
else
_direction := calc_price < lowerBand ? 1 : -1
superTrend := _direction == -1 ? lowerBand : upperBand
[superTrend, _direction]
Inbuilt Backtest Mode:
- The HTST includes an inbuilt backtest mode that enables users to test the indicator's performance against historical data, similar to TradingView strategies.
- The backtest mode allows you to compare the performance of different indicator settings with a simple buy and hold strategy to assess its effectiveness in different market conditions.
Hint Table for Display Modes:
- The indicator includes a Hint Table that recommends the best pane to use for different display modes. For example, it suggests using the "Overlay" mode in the same pane as the price action, while the "Backtest Mode" is better suited for a separate pane. This ensures a more organized and clear visual experience.
- The Hint Table appears as a small table at the bottom of the chart with easy-to-follow recommendations, ensuring the best setup for both visual clarity and indicator functionality.
With these features, the Hyperbolic Tangent SuperTrend Indicator offers traders a versatile and customizable tool for analyzing price trends while providing additional functionalities like backtesting and display mode hints for optimal usability.
Nota Keluaran
Updated the code to pinescript v6, added backtesting library v2 with more backtesting functions and removed old backtesting functions from the codeNota Keluaran
Updated the code to pinescript v6, added backtesting library v2 with more backtesting functions and removed old backtesting functions from the codeSkrip sumber terbuka
Dalam semangat TradingView sebenar, pencipta skrip ini telah menjadikannya sumber terbuka, jadi pedagang boleh menilai dan mengesahkan kefungsiannya. Terima kasih kepada penulis! Walaupuan anda boleh menggunakan secara percuma, ingat bahawa penerbitan semula kod ini tertakluk kepada Peraturan Dalaman.
Penafian
Maklumat dan penerbitan adalah tidak bertujuan, dan tidak membentuk, nasihat atau cadangan kewangan, pelaburan, dagangan atau jenis lain yang diberikan atau disahkan oleh TradingView. Baca lebih dalam Terma Penggunaan.
Skrip sumber terbuka
Dalam semangat TradingView sebenar, pencipta skrip ini telah menjadikannya sumber terbuka, jadi pedagang boleh menilai dan mengesahkan kefungsiannya. Terima kasih kepada penulis! Walaupuan anda boleh menggunakan secara percuma, ingat bahawa penerbitan semula kod ini tertakluk kepada Peraturan Dalaman.
Penafian
Maklumat dan penerbitan adalah tidak bertujuan, dan tidak membentuk, nasihat atau cadangan kewangan, pelaburan, dagangan atau jenis lain yang diberikan atau disahkan oleh TradingView. Baca lebih dalam Terma Penggunaan.