OPEN-SOURCE SCRIPT
Telah dikemas kini Swing Point Volume Z-Score
SWING POINT VOLUME Z-SCORE INDICATOR
A volume analysis tool that identifies statistical volume spikes at swing points with optional higher timeframe confirmation.
This indicator uses Leviathan's method of swing detection. All credit to him for his amazing work (and any mistakes mine). I was also inspired by Trading Riot, who's Capitulation indicator gave me the idea to create this one.
WHAT IT DOES
This indicator combines three analytical approaches:
- Volume Z-score calculation to measure volume significance statistically
- Automatic swing point detection (higher highs, lower lows, etc.)
- Optional higher timeframe volume confirmation
The Z-score measures how many standard deviations current volume is from the average, helping identify when volume activity is genuinely elevated rather than relying on visual assessment.
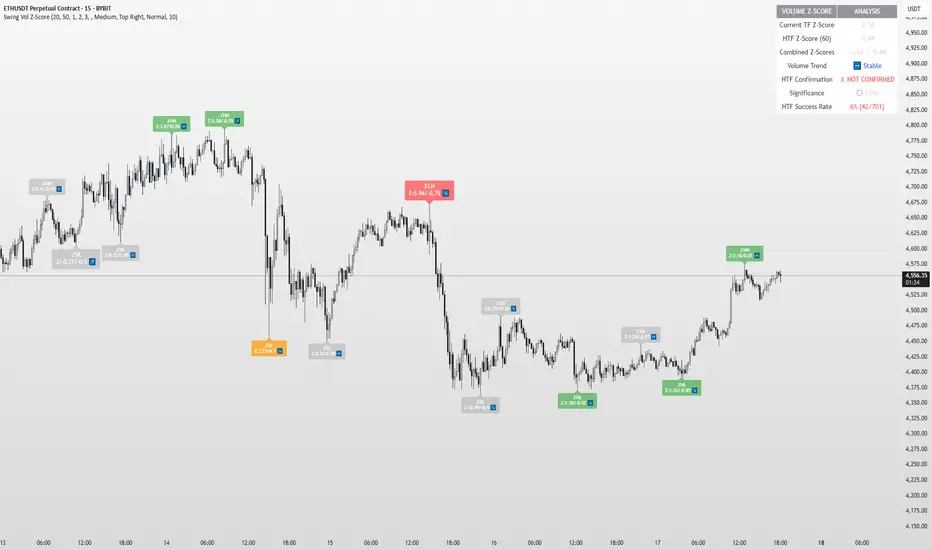
VISUAL SYSTEM
The indicator uses a color-coded approach for quick assessment:
GREEN - Normal Activity (Z-Score 1.0-2.0)
Above-average volume levels
ORANGE - Elevated Activity (Z-Score 2.0-3.0)
High volume activity that may indicate increased interest
RED - Potential Institutional Activity (Z-Score 3.0+)
Very high volume levels that could suggest significant market participation
HIGHER TIMEFRAME CONFIRMATION
When enabled, the indicator checks volume on a higher timeframe:
- Checkmark symbol indicates HTF volume also shows elevation
- X symbol indicates HTF volume doesn't confirm
- Auto-selects appropriate higher timeframe or allows manual selection
KEY FEATURES
Statistical Approach: Uses Z-score methodology rather than arbitrary volume thresholds
Adaptive Thresholds: Can adjust based on market volatility conditions
Swing Focus: Concentrates analysis on structurally important price levels
Volume Trends: Shows whether volume is accelerating or decelerating
Success Tracking: Monitors how often HTF confirmation proves effective
DISPLAY OPTIONS
Basic Mode: Essential features with clean interface
Advanced Mode: Additional customization and analytics
Label Sizing: Four size options to fit different screen setups
Table Position: Moveable info table with transparency control
Custom Colors: Adjustable for different chart themes
PRACTICAL APPLICATIONS
May help identify:
- Volume spikes at support/resistance levels
- Potential accumulation or distribution zones
- Breakout confirmation with volume backing
- Areas where larger market participants might be active
Works on all liquid markets and timeframes, though generally more effective on 15-minute charts and higher.
USAGE NOTES
This is an analytical tool that highlights statistically significant volume events. It should be used as part of a broader analysis approach rather than as a standalone trading system.
The indicator works best when combined with:
- Price action analysis
- Support and resistance identification
- Trend analysis
- Proper risk management
Default settings are designed to work well across most instruments, but users can adjust parameters based on their specific needs and trading style.
TECHNICAL DETAILS
Built with Pine Script v5
Compatible with all TradingView subscription levels
Open source code available for review and learning
Works on stocks, forex, crypto, futures, and other liquid instruments
The statistical approach helps remove some subjectivity from volume analysis, though like all technical indicators, it should be used thoughtfully as part of a complete trading plan.
A volume analysis tool that identifies statistical volume spikes at swing points with optional higher timeframe confirmation.
This indicator uses Leviathan's method of swing detection. All credit to him for his amazing work (and any mistakes mine). I was also inspired by Trading Riot, who's Capitulation indicator gave me the idea to create this one.
WHAT IT DOES
This indicator combines three analytical approaches:
- Volume Z-score calculation to measure volume significance statistically
- Automatic swing point detection (higher highs, lower lows, etc.)
- Optional higher timeframe volume confirmation
The Z-score measures how many standard deviations current volume is from the average, helping identify when volume activity is genuinely elevated rather than relying on visual assessment.
VISUAL SYSTEM
The indicator uses a color-coded approach for quick assessment:
GREEN - Normal Activity (Z-Score 1.0-2.0)
Above-average volume levels
ORANGE - Elevated Activity (Z-Score 2.0-3.0)
High volume activity that may indicate increased interest
RED - Potential Institutional Activity (Z-Score 3.0+)
Very high volume levels that could suggest significant market participation
HIGHER TIMEFRAME CONFIRMATION
When enabled, the indicator checks volume on a higher timeframe:
- Checkmark symbol indicates HTF volume also shows elevation
- X symbol indicates HTF volume doesn't confirm
- Auto-selects appropriate higher timeframe or allows manual selection
KEY FEATURES
Statistical Approach: Uses Z-score methodology rather than arbitrary volume thresholds
Adaptive Thresholds: Can adjust based on market volatility conditions
Swing Focus: Concentrates analysis on structurally important price levels
Volume Trends: Shows whether volume is accelerating or decelerating
Success Tracking: Monitors how often HTF confirmation proves effective
DISPLAY OPTIONS
Basic Mode: Essential features with clean interface
Advanced Mode: Additional customization and analytics
Label Sizing: Four size options to fit different screen setups
Table Position: Moveable info table with transparency control
Custom Colors: Adjustable for different chart themes
PRACTICAL APPLICATIONS
May help identify:
- Volume spikes at support/resistance levels
- Potential accumulation or distribution zones
- Breakout confirmation with volume backing
- Areas where larger market participants might be active
Works on all liquid markets and timeframes, though generally more effective on 15-minute charts and higher.
USAGE NOTES
This is an analytical tool that highlights statistically significant volume events. It should be used as part of a broader analysis approach rather than as a standalone trading system.
The indicator works best when combined with:
- Price action analysis
- Support and resistance identification
- Trend analysis
- Proper risk management
Default settings are designed to work well across most instruments, but users can adjust parameters based on their specific needs and trading style.
TECHNICAL DETAILS
Built with Pine Script v5
Compatible with all TradingView subscription levels
Open source code available for review and learning
Works on stocks, forex, crypto, futures, and other liquid instruments
The statistical approach helps remove some subjectivity from volume analysis, though like all technical indicators, it should be used thoughtfully as part of a complete trading plan.
Nota Keluaran
Swing Point Volume Z-ScoreOverview:
This indicator combines statistical volume analysis with swing point detection and higher timeframe confirmation. It applies z-score calculations specifically to volume at structurally significant price levels (swing points) rather than analyzing all bars indiscriminately.
Unique Methodology:
Unlike general volume z-score indicators that analyze every bar, this indicator focuses exclusively on volume activity at swing points - areas where price creates higher highs, lower lows, higher lows, or lower highs. This targeted approach concentrates analysis on structurally important levels where institutional activity is more likely to be significant.
Technical Components:
Swing Point Detection:
Uses established swing point identification methodology (credited to Leviathan's swing detection method)
Identifies structural price levels: higher highs, lower lows, higher lows, lower highs
Configurable lookback parameters for swing sensitivity
Volume Z-Score Calculation:
Calculates how many standard deviations current volume deviates from historical average
Applied only when swing points are confirmed, not on every bar
Statistical approach removes subjective volume interpretation
Higher Timeframe Confirmation:
Optional verification of volume elevation on a higher timeframe
Automatic timeframe selection or manual override
Visual confirmation symbols (checkmark for confirmation, X for divergence)
Novel Combination:
Research of existing TradingView indicators shows this is the first to combine:
Statistical volume analysis (z-score methodology)
Exclusive focus on swing point structure
Higher timeframe volume confirmation
All three elements integrated into a single analytical framework
Volume Profile indicators focus on price levels rather than swing structure timing
Higher Timeframe Volume indicators lack swing point focus and statistical measurement
Display System:
Color-coded visual system based on z-score thresholds:
Green: Normal elevated activity (Z-Score 1.0-2.0)
Orange: High activity (Z-Score 2.0-3.0)
Red: Extreme activity (Z-Score 3.0+)
Higher timeframe confirmation symbols
Customizable appearance options
Parameters:
Swing detection sensitivity (bars left/right)
Z-score calculation period
Higher timeframe selection (auto or manual)
Visual display options and thresholds
Important Limitations:
Swing point detection introduces lag as structure must be confirmed
Z-score calculations require sufficient historical data for meaningful statistical analysis
Higher timeframe confirmation may not be available on very short timeframes
Statistical significance does not guarantee trading success or predict future price movements
Volume data quality varies across different markets and instruments
Usage Framework:
Identifies when volume at swing points is statistically unusual relative to historical patterns
Higher timeframe confirmation adds context to volume readings
Can be used to assess the significance of breakouts, reversals, or continuation patterns at structural levels
Critical Warnings:
This is an analytical tool, not a trading system
Statistical volume spikes do not predict future price direction
Should be used in conjunction with other analysis methods
Past volume behavior provides no guarantee of future patterns
Requires proper risk management and additional confirmation
Attribution:
Uses Leviathan's swing detection methodology (with full credit) and was inspired by Trading Riot's Capitulation indicator concept.
Nota Keluaran
UPDATE: Added Real-Time Alerts and Quick ModeNew Features:
Real-time volume alerts without swing confirmation delay
Quick mode with 3-bar confirmation option (default remains 20-bar)
Price action triggers for breakouts and momentum shifts
Immediate institutional/elevated volume detection
Live alert status in info table
Settings:
Swing length minimum reduced to 3 bars
Toggle for real-time alerts
Toggle for price action triggers
Quick mode toggle for faster signals
Alert Types:
Instant volume spikes
HTF confirmed signals without delay
Breakout alerts with volume confirmation
Momentum divergence detection
This update adds immediate signal options for active trading while preserving the original swing-based analysis. Users can choose confirmation speed based on their trading timeframe.
Nota Keluaran
Updated with extra display optionsSkrip sumber terbuka
Dalam semangat TradingView sebenar, pencipta skrip ini telah menjadikannya sumber terbuka, jadi pedagang boleh menilai dan mengesahkan kefungsiannya. Terima kasih kepada penulis! Walaupuan anda boleh menggunakan secara percuma, ingat bahawa penerbitan semula kod ini tertakluk kepada Peraturan Dalaman.
Penafian
Maklumat dan penerbitan adalah tidak bertujuan, dan tidak membentuk, nasihat atau cadangan kewangan, pelaburan, dagangan atau jenis lain yang diberikan atau disahkan oleh TradingView. Baca lebih dalam Terma Penggunaan.
Skrip sumber terbuka
Dalam semangat TradingView sebenar, pencipta skrip ini telah menjadikannya sumber terbuka, jadi pedagang boleh menilai dan mengesahkan kefungsiannya. Terima kasih kepada penulis! Walaupuan anda boleh menggunakan secara percuma, ingat bahawa penerbitan semula kod ini tertakluk kepada Peraturan Dalaman.
Penafian
Maklumat dan penerbitan adalah tidak bertujuan, dan tidak membentuk, nasihat atau cadangan kewangan, pelaburan, dagangan atau jenis lain yang diberikan atau disahkan oleh TradingView. Baca lebih dalam Terma Penggunaan.