OPEN-SOURCE SCRIPT
Delta Volume Heatmap
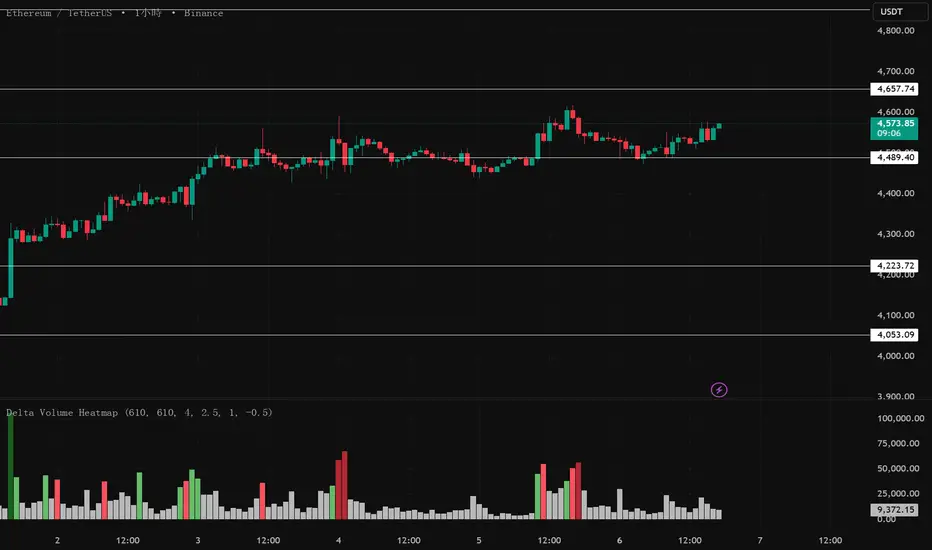
🔥 Delta Volume Heatmap
The Delta Volume Heatmap visualizes the real-time strength of per-bar delta volume — highlighting the imbalance between buying and selling pressure.
Each column’s color intensity reflects how strong the delta volume deviates from its moving average and standard deviation.
🟩 Green tones = Buy-dominant activity (bullish imbalance)
🟥 Red tones = Sell-dominant activity (bearish imbalance)
This tool helps traders quickly identify:
Abnormal volume spikes
Absorption or exhaustion zones
Potential reversal or continuation signals
Skrip sumber terbuka
Dalam semangat TradingView sebenar, pencipta skrip ini telah menjadikannya sumber terbuka, jadi pedagang boleh menilai dan mengesahkan kefungsiannya. Terima kasih kepada penulis! Walaupuan anda boleh menggunakan secara percuma, ingat bahawa penerbitan semula kod ini tertakluk kepada Peraturan Dalaman.
Penafian
Maklumat dan penerbitan adalah tidak bertujuan, dan tidak membentuk, nasihat atau cadangan kewangan, pelaburan, dagangan atau jenis lain yang diberikan atau disahkan oleh TradingView. Baca lebih dalam Terma Penggunaan.