PROTECTED SOURCE SCRIPT
Telah dikemas kini YUSUF LOG 1.deneme
This indicator integrates multiple data points and uses them together to generate auxiliary buy or sell signals. It relies on volume, overbought/oversold signals, and moving averages. It should not be used alone but rather as part of a broader strategy to aid in decision-making.
Nota Keluaran
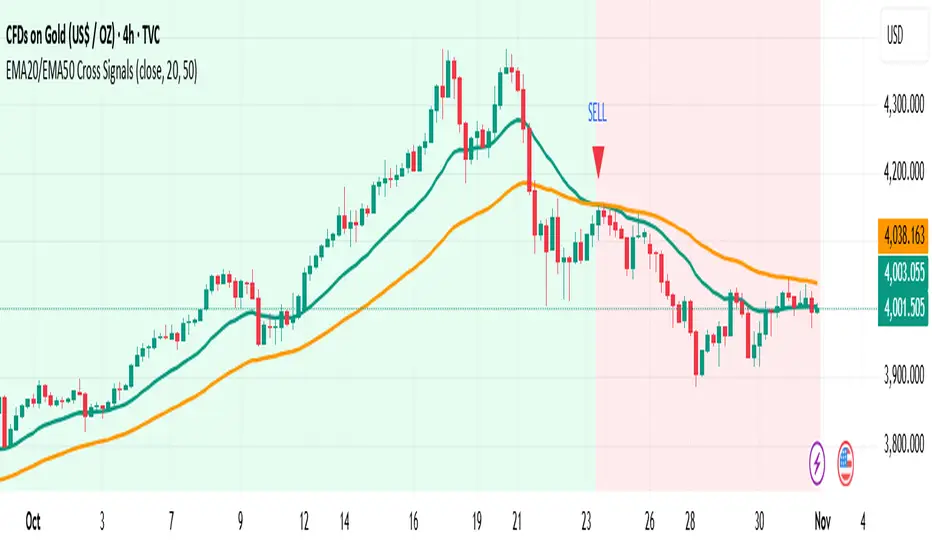
What it doesGenerates BUY and SELL signals when the EMA 20 crosses the EMA 50. It plots both EMAs, paints background by trend, and can trigger TradingView alerts.
How it works
BUY: when EMA20 crosses above EMA50.
SELL: when EMA20 crosses below EMA50.
Optional confirmation requires the candle close to be above/below both EMAs to reduce whipsaws.
Inputs
Source: price source (default: close).
Fast EMA / Slow EMA: default 20 / 50, fully adjustable.
Require close confirm: on/off filter for stronger signals.
Color background by trend: visual trend context.
Visuals & Alerts
Plots EMA20 and EMA50.
Draws upward/downward triangles for Buy/Sell signals.
Two alert conditions: BUY (EMA20 x EMA50 Up) and SELL (EMA20 x EMA50 Down).
Best practices
Use higher timeframes (e.g., H1/H4) or enable confirmation to reduce noise.
Combine with support/resistance and volume for better entries and exits.
Consider ATR-based stops and partial take-profits around recent structure levels.
Skrip dilindungi
Skrip ini diterbitkan sebagai sumber tertutup. Akan tetapi, anda boleh menggunakannya secara bebas dan tanpa apa-apa had – ketahui lebih di sini.
Penafian
Maklumat dan penerbitan adalah tidak bertujuan, dan tidak membentuk, nasihat atau cadangan kewangan, pelaburan, dagangan atau jenis lain yang diberikan atau disahkan oleh TradingView. Baca lebih dalam Terma Penggunaan.