OPEN-SOURCE SCRIPT
Telah dikemas kini SMA 119
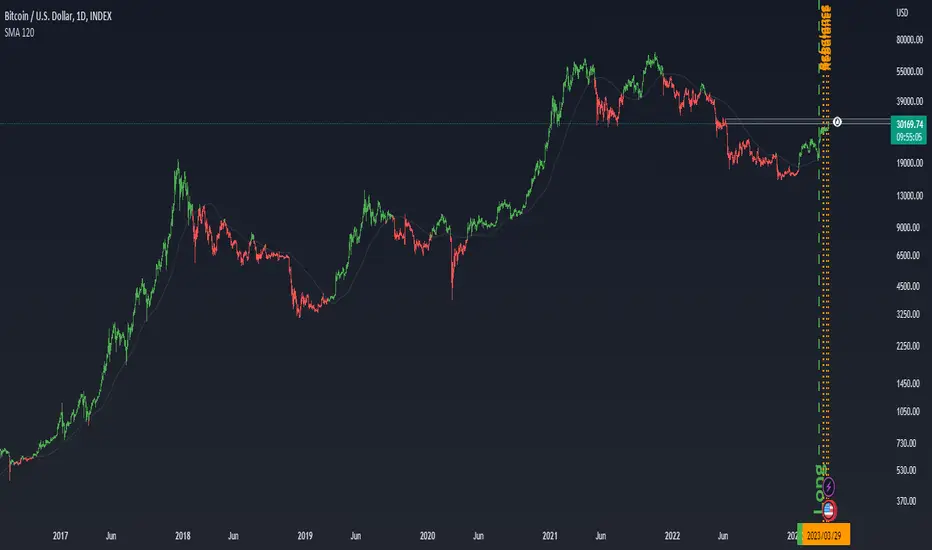
Sometimes simplicity is a key.
This is a Simple Moving Average of 119 period on daily timeframe.
When hl2 of price is above SMA it plot green candles (up trend), when below it plot red candles (down trend)
So it shows you a long term direction of BTC
It is very useful indicator to see in what stage BTC is now, Bear or Bull. Yes it seems to be very simple, but it works.
Sometimes to dig a hole, you dont need an excavator you just need an shovel. In this case shovel is a SMA =)
BackTest of indicator
https://www.tradingview.com/x/boR3okbF
Nota Keluaran
-Skrip sumber terbuka
Dalam semangat TradingView sebenar, pencipta skrip ini telah menjadikannya sumber terbuka, jadi pedagang boleh menilai dan mengesahkan kefungsiannya. Terima kasih kepada penulis! Walaupuan anda boleh menggunakan secara percuma, ingat bahawa penerbitan semula kod ini tertakluk kepada Peraturan Dalaman.
Penafian
Maklumat dan penerbitan adalah tidak bertujuan, dan tidak membentuk, nasihat atau cadangan kewangan, pelaburan, dagangan atau jenis lain yang diberikan atau disahkan oleh TradingView. Baca lebih dalam Terma Penggunaan.
Skrip sumber terbuka
Dalam semangat TradingView sebenar, pencipta skrip ini telah menjadikannya sumber terbuka, jadi pedagang boleh menilai dan mengesahkan kefungsiannya. Terima kasih kepada penulis! Walaupuan anda boleh menggunakan secara percuma, ingat bahawa penerbitan semula kod ini tertakluk kepada Peraturan Dalaman.
Penafian
Maklumat dan penerbitan adalah tidak bertujuan, dan tidak membentuk, nasihat atau cadangan kewangan, pelaburan, dagangan atau jenis lain yang diberikan atau disahkan oleh TradingView. Baca lebih dalam Terma Penggunaan.