OPEN-SOURCE SCRIPT
Z-Score Support & Resistance [SS}
Hello everyone,
This is the Z-Score Support and Resistance (S/R) indicator.
How it works:
The trouble with most indicators and strategies that rely on distributions is that they are constantly moving targets.
To combat this, what I have done is anchored the assessment of the normal distribution to the period open price and dropped the data from the current day.
This provides us with a static assessment of the current distribution and static target levels.
It then plots out an assessment of what would be neutral (0 Standard Deviations) all the way up to +3 Standard Deviations and all the way down to -3 Standard Deviations.
It can plot out this assessment on any timeframe, from the minutes to the months to the years, simply select which desired timeframe you want in the settings menu (default is 9 which seems to work well for most generic tickers and indicies).
The indicator will also count the number of times a ticker has closed within each designated period. To do this, please make sure that you have the assessment timeframe opened on the chart. So if you want to look at the instances on the daily timeframe, ensure you have the daily timeframe opened. If you want to look on the monthly, ensure you have the monthly opened, etc. (See below):

How to Use:
To use the indicator, its pretty simple.
Simply select the desired timeframe you want to use as S/R and use it!
You can adjust the period lookback from the defaulted 9 period based on:
a) The degree of normality in the dataset (you can use a kurtosis indicator to help you ascertain this); or
b) The back-test results of closes within a desired range.
For the later, you can see an example below:
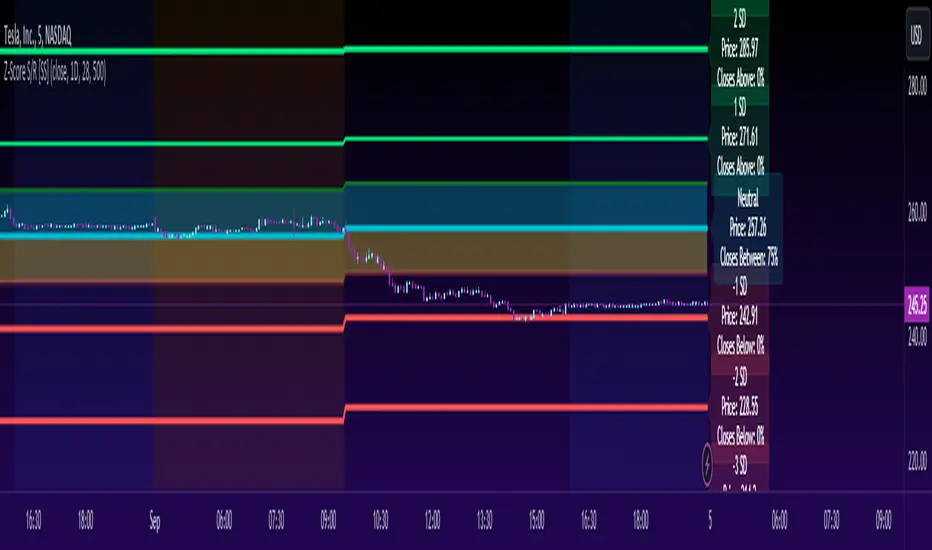
This is TSLA with a 9 period lookback:

We can see that 50% of closes are happening within 0.5 and -0.5 standard deviations. If we extend this to a 15 period lookback:

Now over 60% of closes are happening in this area.
Why does this matter? Well, because now we know our prime short and long entries (see below):

The green arrows represent prime long setups and the red prime short setups.
This is because we know, 61% of the time the ticker will close between 0.5 and -0.5 standard deviations, so we can trade the ticker back to this area.
Further instructions:
Because it is somewhat of a complex indicator, I have done a tutorial video that I will link below here:

And that is the indicator my friends! Hopefully you enjoy :-).
As always, leave your comments and suggestions / Questions below!
Safe trades!
This is the Z-Score Support and Resistance (S/R) indicator.
How it works:
The trouble with most indicators and strategies that rely on distributions is that they are constantly moving targets.
To combat this, what I have done is anchored the assessment of the normal distribution to the period open price and dropped the data from the current day.
This provides us with a static assessment of the current distribution and static target levels.
It then plots out an assessment of what would be neutral (0 Standard Deviations) all the way up to +3 Standard Deviations and all the way down to -3 Standard Deviations.
It can plot out this assessment on any timeframe, from the minutes to the months to the years, simply select which desired timeframe you want in the settings menu (default is 9 which seems to work well for most generic tickers and indicies).
The indicator will also count the number of times a ticker has closed within each designated period. To do this, please make sure that you have the assessment timeframe opened on the chart. So if you want to look at the instances on the daily timeframe, ensure you have the daily timeframe opened. If you want to look on the monthly, ensure you have the monthly opened, etc. (See below):
How to Use:
To use the indicator, its pretty simple.
Simply select the desired timeframe you want to use as S/R and use it!
You can adjust the period lookback from the defaulted 9 period based on:
a) The degree of normality in the dataset (you can use a kurtosis indicator to help you ascertain this); or
b) The back-test results of closes within a desired range.
For the later, you can see an example below:
This is TSLA with a 9 period lookback:
We can see that 50% of closes are happening within 0.5 and -0.5 standard deviations. If we extend this to a 15 period lookback:
Now over 60% of closes are happening in this area.
Why does this matter? Well, because now we know our prime short and long entries (see below):
The green arrows represent prime long setups and the red prime short setups.
This is because we know, 61% of the time the ticker will close between 0.5 and -0.5 standard deviations, so we can trade the ticker back to this area.
Further instructions:
Because it is somewhat of a complex indicator, I have done a tutorial video that I will link below here:
And that is the indicator my friends! Hopefully you enjoy :-).
As always, leave your comments and suggestions / Questions below!
Safe trades!
Skrip sumber terbuka
Dalam semangat TradingView sebenar, pencipta skrip ini telah menjadikannya sumber terbuka, jadi pedagang boleh menilai dan mengesahkan kefungsiannya. Terima kasih kepada penulis! Walaupuan anda boleh menggunakan secara percuma, ingat bahawa penerbitan semula kod ini tertakluk kepada Peraturan Dalaman.
Get:
- Live Updates,
- Discord access,
- Access to my Proprietary Merlin Software,
- Access to premium indicators,
patreon.com/steversteves
Now on X!
- Live Updates,
- Discord access,
- Access to my Proprietary Merlin Software,
- Access to premium indicators,
patreon.com/steversteves
Now on X!
Penafian
Maklumat dan penerbitan adalah tidak bertujuan, dan tidak membentuk, nasihat atau cadangan kewangan, pelaburan, dagangan atau jenis lain yang diberikan atau disahkan oleh TradingView. Baca lebih dalam Terma Penggunaan.