OPEN-SOURCE SCRIPT
Telah dikemas kini Fed Rate Change Impact
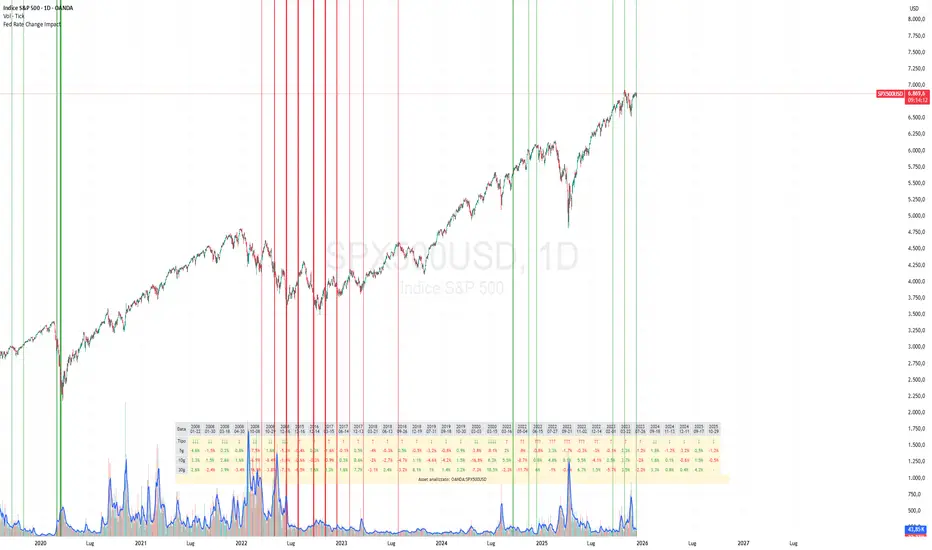
📊 Fed Rate Change Impact — Macro Event-Driven Indicator
Fed Rate Change Impact is an advanced indicator designed to analyze the impact of Federal Reserve interest rate changes on financial markets. It integrates event-driven logic with dynamic visualization, percentage diagnostics, and multi-asset selection, offering a clear and customizable view of post-event effects.
🔍 Key Features 📅 Preloaded Fed Events: Includes over 30 historical rate cut (↓) and hike (↑) dates from 2008 to 2024.
📈 Post-Event Analysis: Calculates the percentage change of the selected asset 5, 10, and 30 days after each event.
📌 Vertical Chart Lines: Visually highlights each event directly on the chart, with dynamic coloring (red for hikes, green for cuts).
📋 Diagnostic Table: Displays real-time impact for each event, with color-coded values and a compact layout.
🧠 Interactive Filter: Choose to display only hikes, only cuts, or both.
🧭 Flexible Asset Selection: Analyze the current chart asset, pick from a predefined list, or manually input any ticker via input.symbol().
🎯 Contextual Highlighting: The table highlights the analyzed asset if it matches the active chart symbol.
⚙️ Customizable Parameters lookahead5, lookahead10, lookahead30: Define the time horizon for measuring post-event impact.
eventFilter: Choose which type of events to display.
presetAsset / customAsset: Select or input the asset to analyze.
🧪 Recommended Use Cases Macroeconomic analysis on indices, commodities, crypto, and forex
Studying delayed effects of rate changes on sensitive assets
Building event-driven strategies or diagnostic overlays
Visual backtesting and cross-asset comparison
🧠 Technical Notes The indicator is compatible with overlay=true and works best on Daily timeframe.
The table automatically adapts to the number of events and includes visual padding for improved readability.
All calculations are performed in real time and require no external data.
Nota Keluaran
. new FED dates must be added in the presetAssetNota Keluaran
* correct arrangement of vertical linesNota Keluaran
Update cut - The size of the lines refers to the extent of the change in ratesSkrip sumber terbuka
Dalam semangat TradingView sebenar, pencipta skrip ini telah menjadikannya sumber terbuka, jadi pedagang boleh menilai dan mengesahkan kefungsiannya. Terima kasih kepada penulis! Walaupuan anda boleh menggunakan secara percuma, ingat bahawa penerbitan semula kod ini tertakluk kepada Peraturan Dalaman.
Penafian
Maklumat dan penerbitan adalah tidak bertujuan, dan tidak membentuk, nasihat atau cadangan kewangan, pelaburan, dagangan atau jenis lain yang diberikan atau disahkan oleh TradingView. Baca lebih dalam Terma Penggunaan.
Skrip sumber terbuka
Dalam semangat TradingView sebenar, pencipta skrip ini telah menjadikannya sumber terbuka, jadi pedagang boleh menilai dan mengesahkan kefungsiannya. Terima kasih kepada penulis! Walaupuan anda boleh menggunakan secara percuma, ingat bahawa penerbitan semula kod ini tertakluk kepada Peraturan Dalaman.
Penafian
Maklumat dan penerbitan adalah tidak bertujuan, dan tidak membentuk, nasihat atau cadangan kewangan, pelaburan, dagangan atau jenis lain yang diberikan atau disahkan oleh TradingView. Baca lebih dalam Terma Penggunaan.